

Consumer Insights
Uncover trends and behaviors shaping consumer choices today
Procurement Insights
Optimize your sourcing strategy with key market data
Industry Stats
Stay ahead with the latest trends and market analysis.

Australia webcam market size reached around USD 121.86 Million in 2025. The market is projected to grow at a CAGR of 7.30% between 2026 and 2035 to reach nearly USD 246.52 Million by 2035.
Base Year
Historical Period
Forecast Period
Skype has nearly 4.07 million active user accounts in Australia. This has consequently increased Australia webcam market revenue.
As per industry reports, over 45% of women in Australia have remote jobs.
37.8% of men aged 35-44 years in Australia have the flexibility of remote work.
Compound Annual Growth Rate
7.3%
Value in USD Million
2026-2035
*this image is indicative*
| Australia Webcam Market Report Summary | Description | Value |
| Base Year | USD Million | 2025 |
| Historical Period | USD Million | 2019-2025 |
| Forecast Period | USD Million | 2026-2035 |
| Market Size 2025 | USD Million | 121.86 |
| Market Size 2035 | USD Million | 246.52 |
| CAGR 2019-2025 | Percentage | XX% |
| CAGR 2026-2035 | Percentage | 7.30% |
| CAGR 2026-2035 - Market by Region | Australian Capital Territory | 8.3% |
| CAGR 2026-2035 - Market by Region | Western Australia | 7.8% |
| CAGR 2026-2035 - Market by Webcam Type | External Webcam | 8.0% |
| CAGR 2026-2035 - Market by End Use | Security and Surveillance | 8.2% |
| 2025 Market Share by Region | Victoria | 23.1% |
Nations with higher per-capita GDPs report a high prevalence of remote work. In Australia, 39% of all jobs (including 35% part-time and 41% full-time) can be performed remotely. The Australian Capital Territory reports the highest levels of tele-workers (50.3%), followed by Victoria (40%) and the Northern Territory (39.5%). Queensland (37.2%), Western Australia (36.8%), Southern Australia (36.2%), and Tasmania (34.9%). This is expected to increase the demand for external webcams during the forecast period, thereby driving Australia webcam market expansion.
In 2024, the number of internet users in Australia rose to 25.31 million, recording a year-on-year growth of 1%. Nearly 81% of the Australian public uses social media platforms, including Facebook (18.63 million), Instagram (14.05 million), TikTok (10.50 million), Twitter (7.77 million), and Pinterest (7.24 million), among others. An average Australian spends 2.04 hours on social media every day. This is expected to promote the adoption of webcams, especially among Gen Z and millennial populations, to create content and interact with others in unique ways. This is favourably shaping the Australia webcam market outlook.
Moreover, in 2020, a devastating bushfire swept burnet 73,000 sq. miles of area across Australia, which reportedly affected the lives of 3 billion animals. As per the Australia State of the Environment report, nearly 70% of all threatened ecological communities and 21%-46% of endangered vertebrates remain unmonitored. The increasing focus on wildlife protection is expected to fuel the demand for webcams in Australia for wildlife monitoring.
Technological advancements; AI integration into digital camera traps; the rise of online education; and soaring demand for telemedicine are trends impacting the Australia webcam market expansion.
Rapid technological advancements in camera devices and sensors are expected to raise the demand for embedded webcams over the forecast period.
The integration of AI into digital camera traps enables wildlife scientists to monitor the behaviour and lifestyle of wild animals in less time and design appropriate wildlife conservation programmes, thereby facilitating the Australia webcam market development.
Most work-related training is conducted in an online mode in Australia. It doubled from 19% in 2016 and reached 55% in 2020. This is boosting the demand for high-quality webcams.
In 2018-19, the average number of telehealth consultations in Australia reached 8.8 per 1,000 people. Webcams enable healthcare professionals to efficiently connect with patients while expanding access to high-quality healthcare services. This has positively impacted the Australia webcam market dynamics.
Laptops and desktop computers are the most popular devices for internet browsing in Australia (55.41%), followed by mobile phones (39.88%) and tablets (4.68%). In 2023, the average speed of broadband internet recorded a y-o-y increase of 25.1%, reaching 51.98 Mbps in 2024. Moreover, Australia webcam market development is being fuelled due to the increase in average speed of mobile internet connection, which is experiencing 13.7% y-o-y growth, reaching 51.98 megabits per second. This is expected to fuel the growth of embedded webcams in Australia.
The EMR’s report titled “Australia Webcam Market Report and Forecast 2026-2035” offers a detailed analysis of the market based on the following segments:
Market Breakup by Webcam Type
Market Breakup by Technology
Market Breakup by End Use
Market Breakup by Region
| CAGR 2026-2035 - Market by | Region |
| Australian Capital Territory | 8.3% |
| Western Australia | 7.8% |
| New South Wales | XX% |
| Victoria | XX% |
| Queensland | XX% |
| Others | XX% |
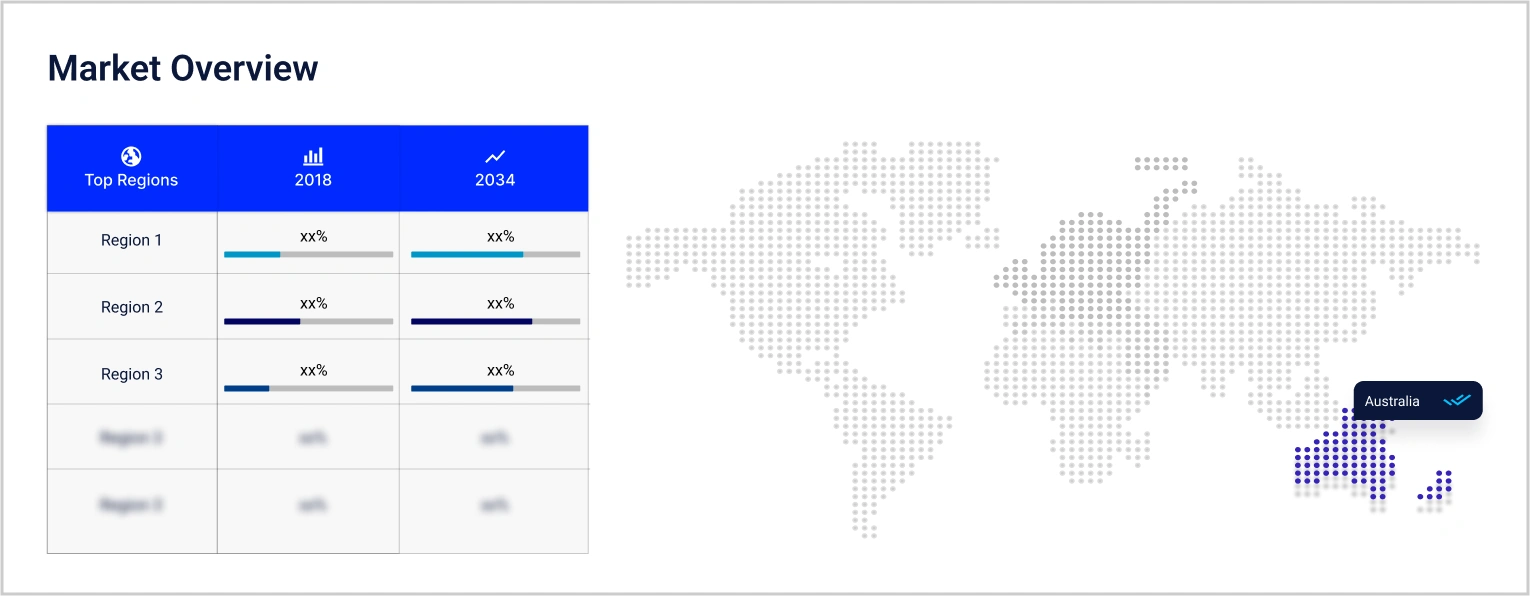
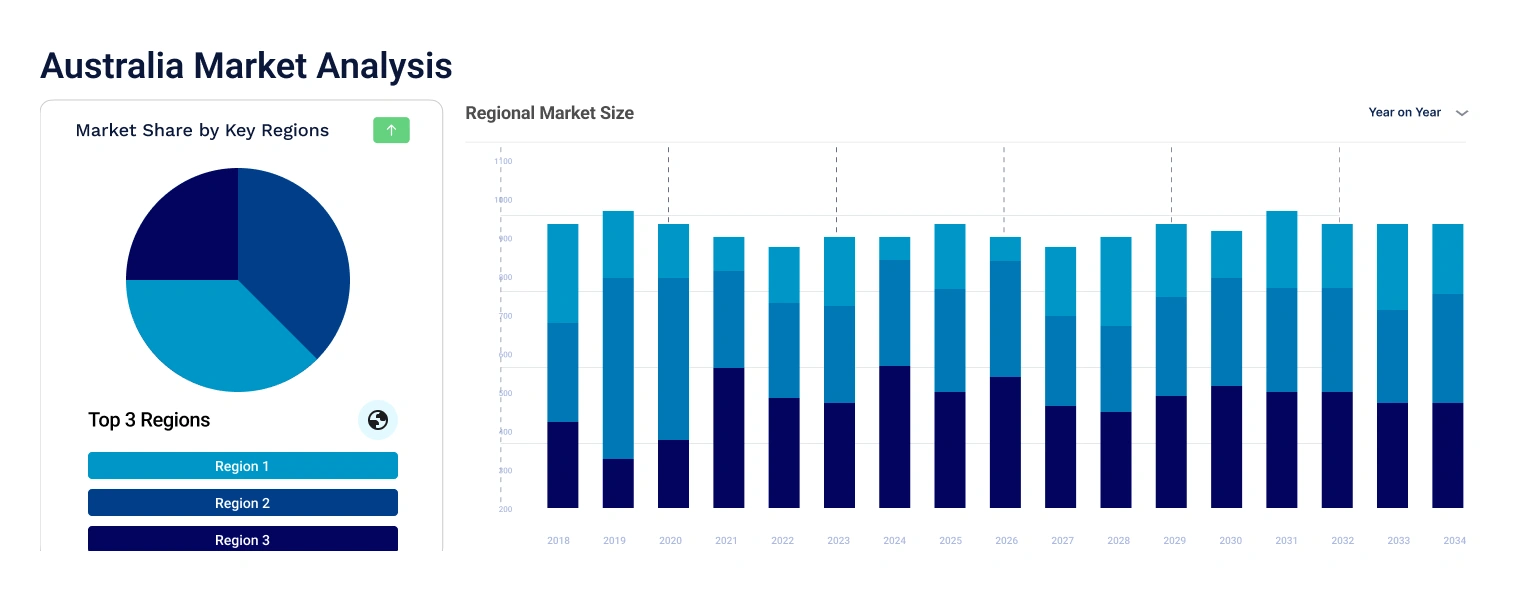
Based on region, the market is segmented into New South Wales, Victoria, Queensland, Australian Capital Territory, and Western Australia, among others. Victoria is projected to dominate the market, representing 23% of the overall market share. Over the forecast period, the Australian Capital Territory is expected to grow at a CAGR of 8.3% because of increasing popularity of content creation among millennials and the shift towards remote work culture in various organisations of the region.
Major webcam manufacturers are incorporating recycled materials into their webcams to reduce their carbon footprint, enhance their appeal among eco-conscious consumers, and gain a significant Australia webcam market share.
Asahi Vision Inc. was founded in 2014 and is headquartered in Nagoya City, Japan. It specialises in the production of medical devices, diagnostic equipment, eye care solutions, and ophthalmic equipment.
HP Development Company was founded in July 1939 and is headquartered in California, United States. It is engaged in designing and manufacturing personal computer systems, software solutions, printers, storage devices, adapters and chargers, and networking products.
Lenovo Group Ltd. was founded in 1984 and is headquartered in Beijing, China. As per the Australia webcam market analysis, it is engaged in manufacturing smartphones, tablets, software, servers, and AR/VR solutions.
Corsair Memory Inc. was founded in 1994 and is headquartered in California, United States. It is engaged in producing computer hardware and consumer electronics products, apart from gaming systems.
*Please note that this is only a partial list; the complete list of key players is available in the full report. Additionally, the list of key players can be customized to better suit your needs.*
Other players included in the Australia webcam market report are Logitech S.A., Microsoft Corporation, Razer Inc., Creative Technology Ltd., LP, AverMedia Technologies, Dell, Inc., and among others.


Upto 15% Off
USD
$3999 $3599
$2499 $2249
$4999 $4249
$5999 $5099


*While we strive to always give you current and accurate information, the numbers depicted on the website are indicative and may differ from the actual numbers in the main report. At Expert Market Research, we aim to bring you the latest insights and trends in the market. Using our analyses and forecasts, stakeholders can understand the market dynamics, navigate challenges, and capitalize on opportunities to make data-driven strategic decisions.*
Get in touch with us for a customized solution tailored to your unique requirements and save upto 35%!
In 2025, the market reached nearly USD 121.86 Million.
The market is assessed to grow at a CAGR of 7.30% between 2026 and 2035.
The market is market is estimated to witness a healthy growth in the forecast period of 2026-2035 to reach about USD 246.52 Million by 2035.
The different types of webcams in the market are external and embedded.
The different market segments based on the technology of the webcam are digital and analog.
The different regions covered in the market report are the New South Wales, Victoria, Queensland, Australian Capital Territory, and Western Australia, among others.
The different end uses of webcams are security and surveillance, entertainment, video conferences, live events, and visual marketing, among others.
Key market players are Logitech S.A., Microsoft Corporation, Razer Inc., Creative Technology Ltd., HP Development Company, LP, AverMedia Technologies, Asahi Vision Inc., Lenovo Group Ltd., Dell, Inc., and Corsair Memory Inc., among others.
Explore our key highlights of the report and gain a concise overview of key findings, trends, and actionable insights that will empower your strategic decisions.
| REPORT FEATURES | DETAILS |
| Base Year | 2025 |
| Historical Period | 2019-2025 |
| Forecast Period | 2026-2035 |
| Scope of the Report |
Historical and Forecast Trends, Industry Drivers and Constraints, Historical and Forecast Market Analysis by Segment:
|
| Breakup by Webcam Type |
|
| Breakup by Technology |
|
| Breakup by End Use |
|
| Breakup by Region |
|
| Market Dynamics |
|
| Competitive Landscape |
|
| Companies Covered |
|
Single User License
One User
USD 3,999
USD 3,599
tax inclusive*
Datasheet
One User
USD 2,499
USD 2,249
tax inclusive*
Five User License
Five User
USD 4,999
USD 4,249
tax inclusive*
Corporate License
Unlimited Users
USD 5,999
USD 5,099
tax inclusive*
*Please note that the prices mentioned below are starting prices for each bundle type. Kindly contact our team for further details.*
Flash Bundle
Small Business Bundle
Growth Bundle
Enterprise Bundle
*Please note that the prices mentioned below are starting prices for each bundle type. Kindly contact our team for further details.*
Flash Bundle
Number of Reports: 3
20%
tax inclusive*
Small Business Bundle
Number of Reports: 5
25%
tax inclusive*
Growth Bundle
Number of Reports: 8
30%
tax inclusive*
Enterprise Bundle
Number of Reports: 10
35%
tax inclusive*
How To Order

Select License Type
Choose the right license for your needs and access rights.

Click on ‘Buy Now’
Add the report to your cart with one click and proceed to register.

Select Mode of Payment
Choose a payment option for a secure checkout. You will be redirected accordingly.
Gain insights to stay ahead and seize opportunities.

Get insights & trends for a competitive edge.

Track prices with detailed trend reports.

Analyse trade data for supply chain insights.

Leverage cost reports for smart savings

Enhance supply chain with partnerships.

Connect For More Information
Our expert team of analysts will offer full support and resolve any queries regarding the report, before and after the purchase.
Our expert team of analysts will offer full support and resolve any queries regarding the report, before and after the purchase.
We employ meticulous research methods, blending advanced analytics and expert insights to deliver accurate, actionable industry intelligence, staying ahead of competitors.
Our skilled analysts offer unparalleled competitive advantage with detailed insights on current and emerging markets, ensuring your strategic edge.
We offer an in-depth yet simplified presentation of industry insights and analysis to meet your specific requirements effectively.


Share