

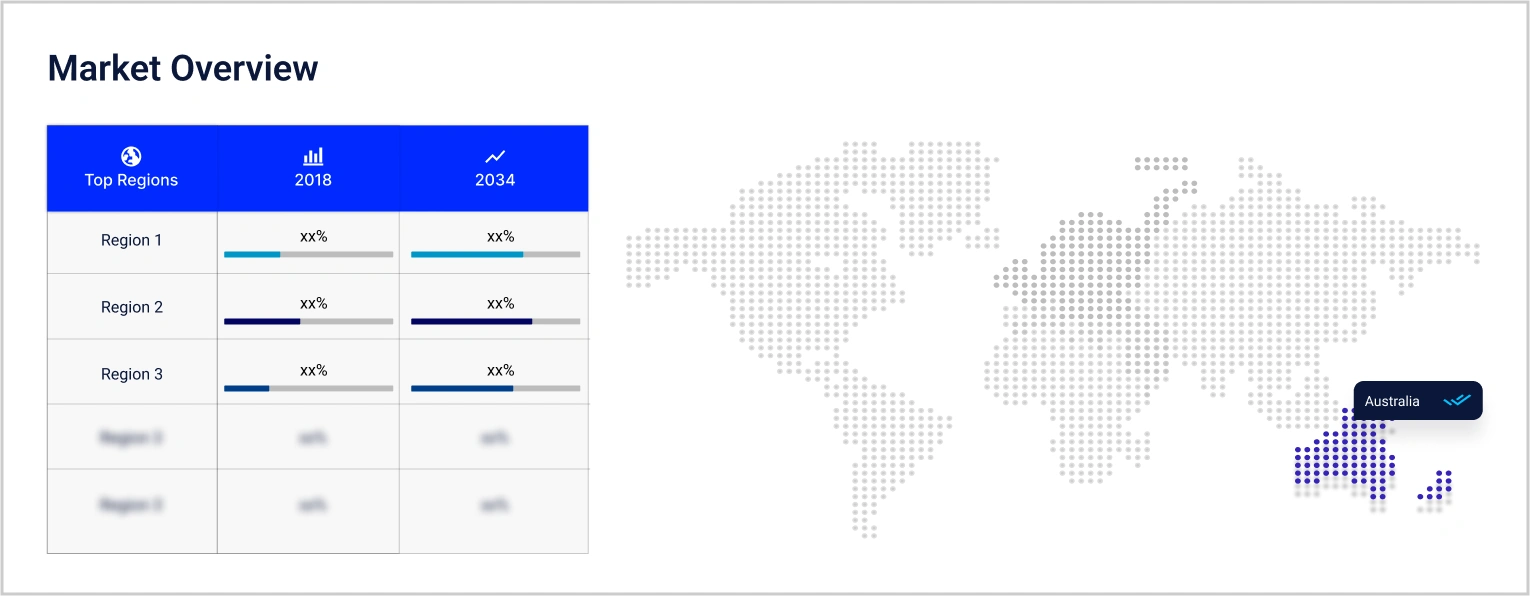
Consumer Insights
Uncover trends and behaviors shaping consumer choices today
Procurement Insights
Optimize your sourcing strategy with key market data
Industry Stats
Stay ahead with the latest trends and market analysis.

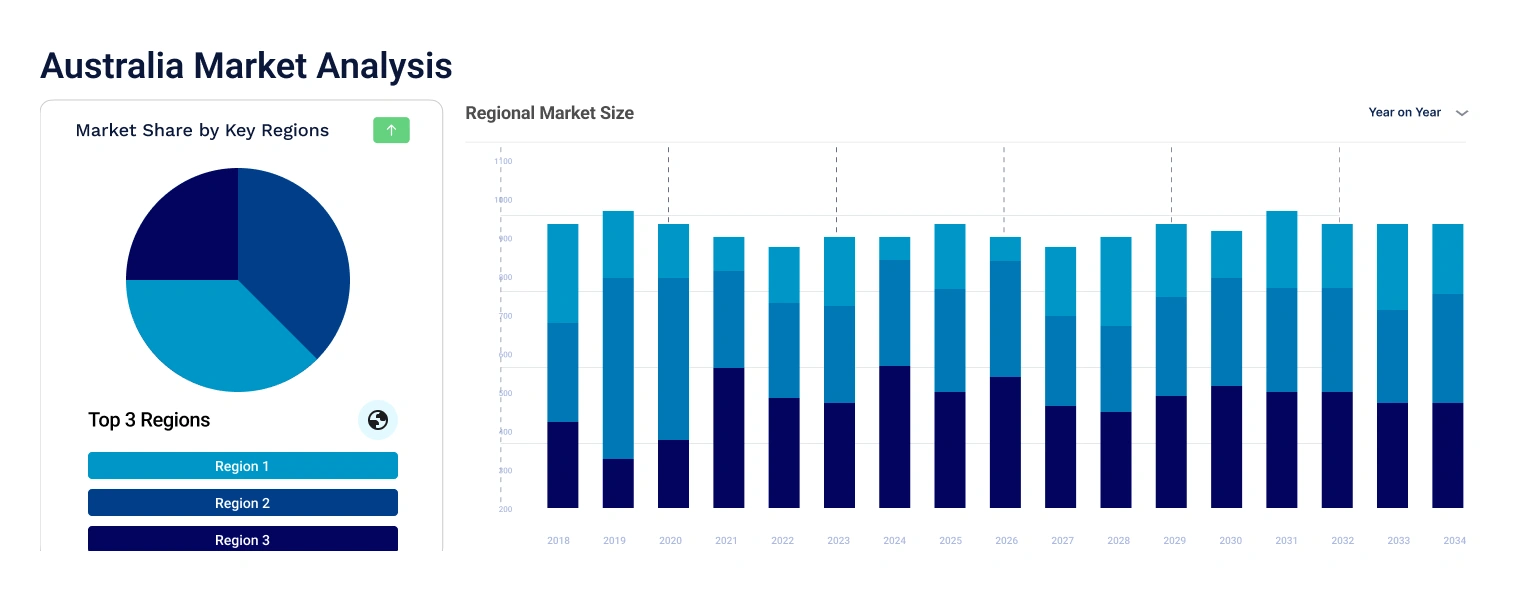
The Australia smartphones market size reached USD 5.70 Billion in 2025. The market is expected to grow at a CAGR of 2.00% between 2026 and 2035, reaching USD 6.95 Billion by 2035.
Base Year
Historical Period
Forecast Period
As per the Australian Bureau of Statistics, film and video production enterprises surpassed subscription broadcasters and channel providers in total income, reaching $4,575.3 million, thereby contributing to the increased demand for smartphones.
In 2023, Telstra, Australia's largest mobile operator, stated that the demand for 5G data on their mobile network is increasing by more than 30% annually.
According to the World Bank, as of 2021, approximately 96% of Australia's population is reported to be utilising the internet.
Compound Annual Growth Rate
2%
Value in USD Billion
2026-2035
*this image is indicative*
| Australia Smartphones Market Report Summary | Description | Value |
| Base Year | USD Billion | 2025 |
| Historical Period | USD Billion | 2019-2025 |
| Forecast Period | USD Billion | 2026-2035 |
| Market Size 2025 | USD Billion | 5.70 |
| Market Size 2035 | USD Billion | 6.95 |
| CAGR 2019-2025 | Percentage | XX% |
| CAGR 2026-2035 | Percentage | 2.00% |
| CAGR 2026-2035 - Market by Region | New South Wales | 2.4% |
| CAGR 2026-2035 - Market by Region | Victoria | 2.1% |
| CAGR 2026-2035 - Market by Operating System | Android | 2.2% |
| CAGR 2026-2035 - Market by Price Range | High-End (More than $800) | 3.4% |
| 2025 Market Share by Region | Victoria | 24.5% |
OLED technology enhances the Australia smartphone market growth by providing displays that offer superior image quality over LCDs. This is because each pixel emits its light, resulting in true blacks and vibrant colours.
OLED technology in smartphones provides exceptional image quality with deep blacks, vivid colours, lightweight builds, bendable, curved displays, energy efficiency, reliable colour precision, brightness, and quicker refresh rates for seamless animations.
LCD technology advantages in smartphones encompass economical pricing, resilience against screen burn-in, enhanced outdoor visibility, steady brightness, and colour precision from various viewing angles.
In 2023, HMD Global, the brand behind Nokia smartphones, debuted its inaugural repairable smartphone, pledging $20 AUD for each April sale.
Australia Smartphones Market Report and Forecast 2026-2035 offers a detailed analysis of the market based on the following segments:
Market Breakup by Operating System
Market Breakup by Display Technology
Market Breakup by RAM Capacity
Market Breakup by Price Range
Market Breakup by Distribution Channel
Market Breakup by Region
| CAGR 2026-2035 - Market by | Region |
| New South Wales | 2.4% |
| Victoria | 2.1% |
| Queensland | XX% |
| Australian Capital Territory | XX% |
| Western Australia | XX% |
| Others | XX% |
The Australia smartphones market key players are:


Upto 15% Off
USD
$2499 $2249
$3999 $3599
$4999 $4249
$5999 $5099


*While we strive to always give you current and accurate information, the numbers depicted on the website are indicative and may differ from the actual numbers in the main report. At Expert Market Research, we aim to bring you the latest insights and trends in the market. Using our analyses and forecasts, stakeholders can understand the market dynamics, navigate challenges, and capitalize on opportunities to make data-driven strategic decisions.*
Get in touch with us for a customized solution tailored to your unique requirements and save upto 35%!
The market was valued at USD 5.70 Billion in 2025.
The market is projected to grow at a CAGR of 2.00% between 2026 and 2035.
The revenue generated from the market is expected to reach USD 6.95 Billion in 2035.
The smartphone market is categorised according to operating systems, which include android, iOS, and others.
The key players are Apple Inc., Samsung Electronics Australia Pty Limited, Huawei Technologies Co., Ltd, Motorola Mobility LLC, and Cell8 Pty Limited among others.
Based on smartphones, the market is divided into OEMs, retailers, and e-commerce.
The market is broken down into New South Wales, Victoria, Queensland, Australian Capital Territory, Western Australia, and others.
Explore our key highlights of the report and gain a concise overview of key findings, trends, and actionable insights that will empower your strategic decisions.
| REPORT FEATURES | DETAILS |
| Base Year | 2025 |
| Historical Period | 2019-2025 |
| Forecast Period | 2026-2035 |
| Scope of the Report |
Historical and Forecast Trends, Industry Drivers and Constraints, Historical and Forecast Market Analysis by Segment:
|
| Breakup by Operating System |
|
| Breakup by Display Technology |
|
| Breakup by RAM Capacity |
|
| Breakup by Price Range |
|
| Breakup by Distribution Channel |
|
| Breakup by Region |
|
| Market Dynamics |
|
| Competitive Landscape |
|
| Companies Covered |
|
Datasheet
One User
USD 2,499
USD 2,249
tax inclusive*
Single User License
One User
USD 3,999
USD 3,599
tax inclusive*
Five User License
Five User
USD 4,999
USD 4,249
tax inclusive*
Corporate License
Unlimited Users
USD 5,999
USD 5,099
tax inclusive*
*Please note that the prices mentioned below are starting prices for each bundle type. Kindly contact our team for further details.*
Flash Bundle
Small Business Bundle
Growth Bundle
Enterprise Bundle
*Please note that the prices mentioned below are starting prices for each bundle type. Kindly contact our team for further details.*
Flash Bundle
Number of Reports: 3
20%
tax inclusive*
Small Business Bundle
Number of Reports: 5
25%
tax inclusive*
Growth Bundle
Number of Reports: 8
30%
tax inclusive*
Enterprise Bundle
Number of Reports: 10
35%
tax inclusive*
How To Order

Select License Type
Choose the right license for your needs and access rights.

Click on ‘Buy Now’
Add the report to your cart with one click and proceed to register.

Select Mode of Payment
Choose a payment option for a secure checkout. You will be redirected accordingly.
Gain insights to stay ahead and seize opportunities.

Get insights & trends for a competitive edge.

Track prices with detailed trend reports.

Analyse trade data for supply chain insights.

Leverage cost reports for smart savings

Enhance supply chain with partnerships.

Connect For More Information
Our expert team of analysts will offer full support and resolve any queries regarding the report, before and after the purchase.
Our expert team of analysts will offer full support and resolve any queries regarding the report, before and after the purchase.
We employ meticulous research methods, blending advanced analytics and expert insights to deliver accurate, actionable industry intelligence, staying ahead of competitors.
Our skilled analysts offer unparalleled competitive advantage with detailed insights on current and emerging markets, ensuring your strategic edge.
We offer an in-depth yet simplified presentation of industry insights and analysis to meet your specific requirements effectively.


Share