

Consumer Insights
Uncover trends and behaviors shaping consumer choices today
Procurement Insights
Optimize your sourcing strategy with key market data
Industry Stats
Stay ahead with the latest trends and market analysis.

The Australia PET preform market reached approximately USD 192.92 Million in 2025. The market is projected to grow at a CAGR of 3.00% between 2026 and 2035, reaching a value of around USD 259.27 Million by 2035.
Base Year
Historical Period
Forecast Period
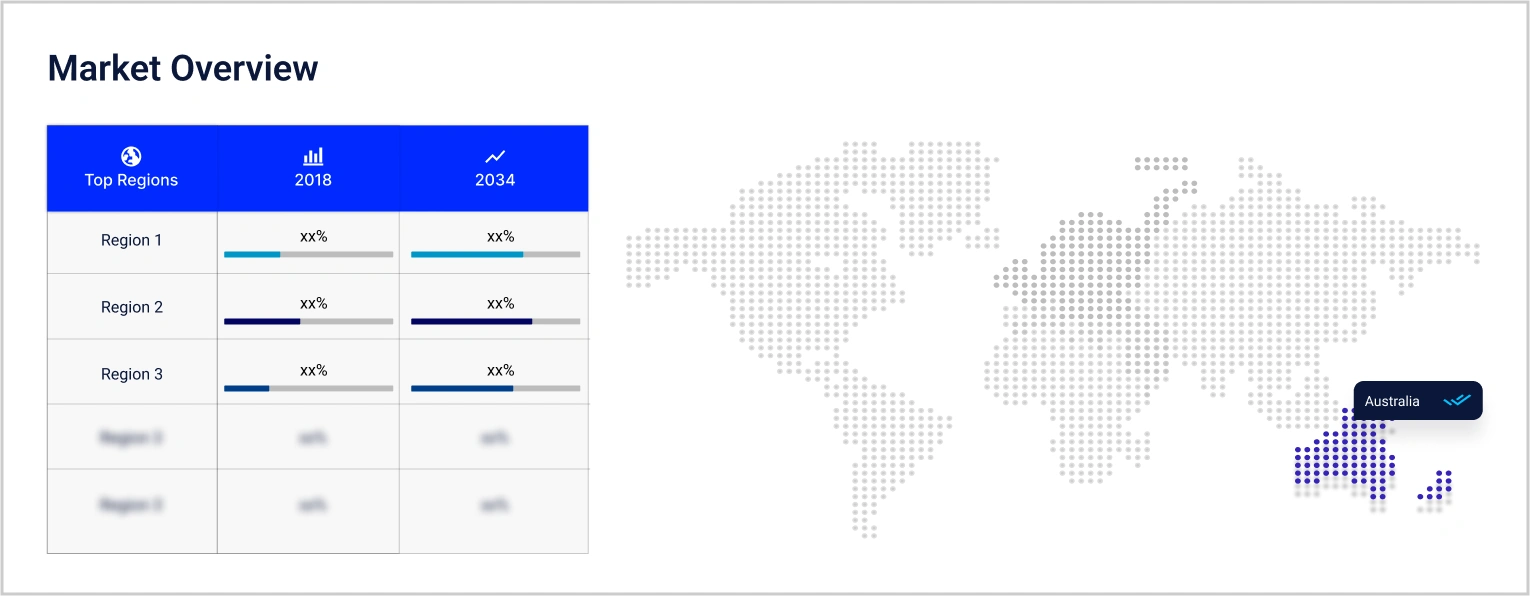
As per the Australian Bureau of Statistics (ABS) data from 2018-19, there were 458 companies operating in the non-alcoholic beverage manufacturing sector in Australia, primarily situated in Queensland, New South Wales, and Victoria.
As stated by the International Trade Administration, the cosmetics industry in Australia holds a value of US$3.5 billion, which contributes to the Australia PET preform market growth.
In 2020–21, the Australian Government expenditure on all PBS and RPBS medicines, amounted to $13.9 billion, equivalent to $541 per individual, as reported by the Australian Institute of Health and Welfare.
Compound Annual Growth Rate
3%
Value in USD Million
2026-2035
*this image is indicative*
| Australia PET Preform Market Report Summary | Description | Value |
| Base Year | USD Million | 2025 |
| Historical Period | USD Million | 2019-2025 |
| Forecast Period | USD Million | 2026-2035 |
| Market Size 2025 | USD Million | 192.92 |
| Market Size 2035 | USD Million | 259.27 |
| CAGR 2019-2025 | Percentage | XX% |
| CAGR 2026-2035 | Percentage | 3.00% |
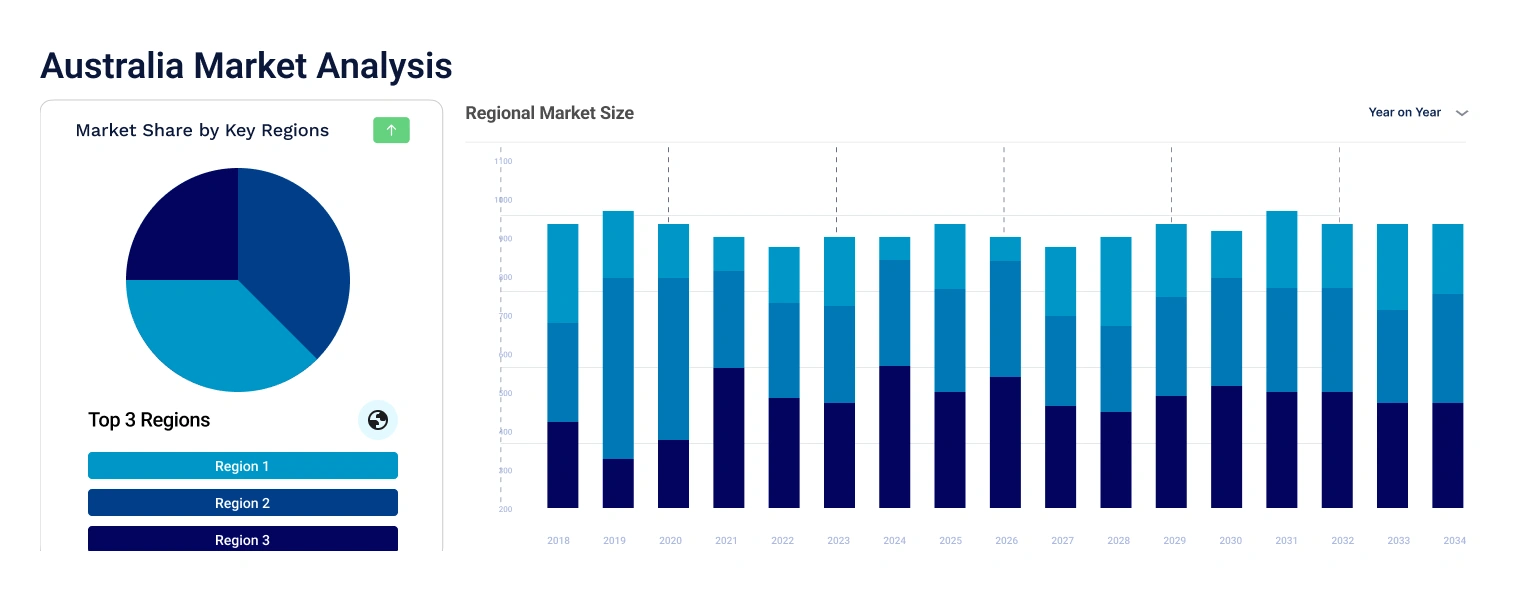
| CAGR 2026-2035 - Market by Region | Victoria | 2.9% |
| CAGR 2026-2035 - Market by Region | New South Wales | 2.4% |
| CAGR 2026-2035 - Market by Type | Standard Preforms | 3.3% |
| CAGR 2026-2035 - Market by End Use | Personal Care | 3.3% |
| Market Share by Country | New South Wales | XX% |
Based on end use, the Australia PET preform market share is led by home care, as PET preforms are lightweight, enhancing ease and affordability in transportation compared to glass containers. This results in potential cost savings for manufacturers and distributors
Portable and lightweight, PET preforms are convenient for home care, aiding in safe liquid storage and promoting independence. Offering a variety of beverages, extended shelf life, and cost-effectiveness, they support hydration, nutrition, and sustainability.
In the beverage industry, PET preforms offer economic advantages with lower energy and transportation costs compared to glass. This efficiency allows for competitive pricing, benefiting both companies and consumers and enhancing affordability and market competitiveness.
PepsiCo introduced Bubly, a sugar-free sparkling water, its first non-core brand beverage in Australia. Bubly aimed to innovate the sparkling water market with flavours like pineapple, lime, blackberry, raspberry, and passionfruit, free of added sugars or artificial sweeteners.
"Australia PET Preform Market Report and Forecast 2026-2035" offers a detailed analysis of the market based on the following segments:
Market Breakup by Type
Market Breakup by Size
Market Breakup by Capacity
Market Breakup by End Use
Market Breakup by Region
| CAGR 2026-2035 - Market by | Type |
| Standard Preforms | 3.3% |
| Specialty Preforms | 2.9% |
| CAGR 2026-2035 - Market by | End Use |
| Personal Care | 3.3% |
| Pharmaceuticals | 3.2% |
| Food and Beverage | 2.9% |
| Others | 2.7% |
| CAGR 2026-2035 - Market by | Country |
| Victoria | 2.9% |
| New South Wales | 2.4% |
| Queensland | 2.7% |
| Australian Capital Territory | 3.4% |
| Western Australia | 3.2% |
| Rest of Australia | 3.1% |
The Australia PET preform market key players are:


Upto 15% Off
USD
$2499 $2249
$3999 $3599
$4999 $4249
$5999 $5099


*While we strive to always give you current and accurate information, the numbers depicted on the website are indicative and may differ from the actual numbers in the main report. At Expert Market Research, we aim to bring you the latest insights and trends in the market. Using our analyses and forecasts, stakeholders can understand the market dynamics, navigate challenges, and capitalize on opportunities to make data-driven strategic decisions.*
Get in touch with us for a customized solution tailored to your unique requirements and save upto 35%!
The market is projected to grow at a CAGR of 3.00% between 2026 and 2035.
The revenue generated from the market is expected to reach USD 259.27 Million in 2035.
The market was valued at USD 192.92 Million in 2025.
The market is categorised according to the capacity, which includes up to 500 ml, 500-1000 ml and more than 2000 ml.
The key players are Amcor CDI, IC PLASTICA, Vision Packaging (Austy.) Pty Limited, Queensland Blow Moulders Pty Ltd., Ant Packaging Pty Ltd., Synergy Packaging Pty Ltd., Weltrade Pty Ltd., and Quality Bowl Moulders (Aust) Pty Ltd. among others.
Based on the end use, the PET preform market is divided into home care, beverages, personal care, food, pharmaceuticals, and others.
The market is broken down into New South Wales, Victoria, Queensland, Australian Capital Territory, Western Australia, and others.
Explore our key highlights of the report and gain a concise overview of key findings, trends, and actionable insights that will empower your strategic decisions.
| REPORT FEATURES | DETAILS |
| Base Year | 2025 |
| Historical Period | 2019-2025 |
| Forecast Period | 2026-2035 |
| Scope of the Report |
Historical and Forecast Trends, Industry Drivers and Constraints, Historical and Forecast Market Analysis by Segment:
|
| Breakup by Type |
|
| Breakup by Size |
|
| Breakup by Capacity |
|
| Breakup by End Use |
|
| Breakup by Region |
|
| Market Dynamics |
|
| Competitive Landscape |
|
| Companies Covered |
|
Datasheet
One User
USD 2,499
USD 2,249
tax inclusive*
Single User License
One User
USD 3,999
USD 3,599
tax inclusive*
Five User License
Five User
USD 4,999
USD 4,249
tax inclusive*
Corporate License
Unlimited Users
USD 5,999
USD 5,099
tax inclusive*
*Please note that the prices mentioned below are starting prices for each bundle type. Kindly contact our team for further details.*
Flash Bundle
Small Business Bundle
Growth Bundle
Enterprise Bundle
*Please note that the prices mentioned below are starting prices for each bundle type. Kindly contact our team for further details.*
Flash Bundle
Number of Reports: 3
20%
tax inclusive*
Small Business Bundle
Number of Reports: 5
25%
tax inclusive*
Growth Bundle
Number of Reports: 8
30%
tax inclusive*
Enterprise Bundle
Number of Reports: 10
35%
tax inclusive*
How To Order

Select License Type
Choose the right license for your needs and access rights.

Click on ‘Buy Now’
Add the report to your cart with one click and proceed to register.

Select Mode of Payment
Choose a payment option for a secure checkout. You will be redirected accordingly.
Gain insights to stay ahead and seize opportunities.

Get insights & trends for a competitive edge.

Track prices with detailed trend reports.

Analyse trade data for supply chain insights.

Leverage cost reports for smart savings

Enhance supply chain with partnerships.

Connect For More Information
Our expert team of analysts will offer full support and resolve any queries regarding the report, before and after the purchase.
Our expert team of analysts will offer full support and resolve any queries regarding the report, before and after the purchase.
We employ meticulous research methods, blending advanced analytics and expert insights to deliver accurate, actionable industry intelligence, staying ahead of competitors.
Our skilled analysts offer unparalleled competitive advantage with detailed insights on current and emerging markets, ensuring your strategic edge.
We offer an in-depth yet simplified presentation of industry insights and analysis to meet your specific requirements effectively.


Share