

Consumer Insights
Uncover trends and behaviors shaping consumer choices today
Procurement Insights
Optimize your sourcing strategy with key market data
Industry Stats
Stay ahead with the latest trends and market analysis.

The Australia online adventure games market size is projected to grow at a CAGR of 6.02% between 2026 and 2035.
Base Year
Historical Period
Forecast Period
Australia Bureau of Statistics reported the top income source for digital game development businesses as multiplatform end-to-end digital game development - USD 181.6M.
Australia's gaming sector, as reported by the Department of Foreign Affairs and Trade, expanded in 2021, yielding USD 226.5 million, with 83% sourced internationally.
In 2021, Australian game development studios employed 1,327 full-time workers, contributing to the growth of the Australia online adventure games market.
Compound Annual Growth Rate
6.02%
2026-2035
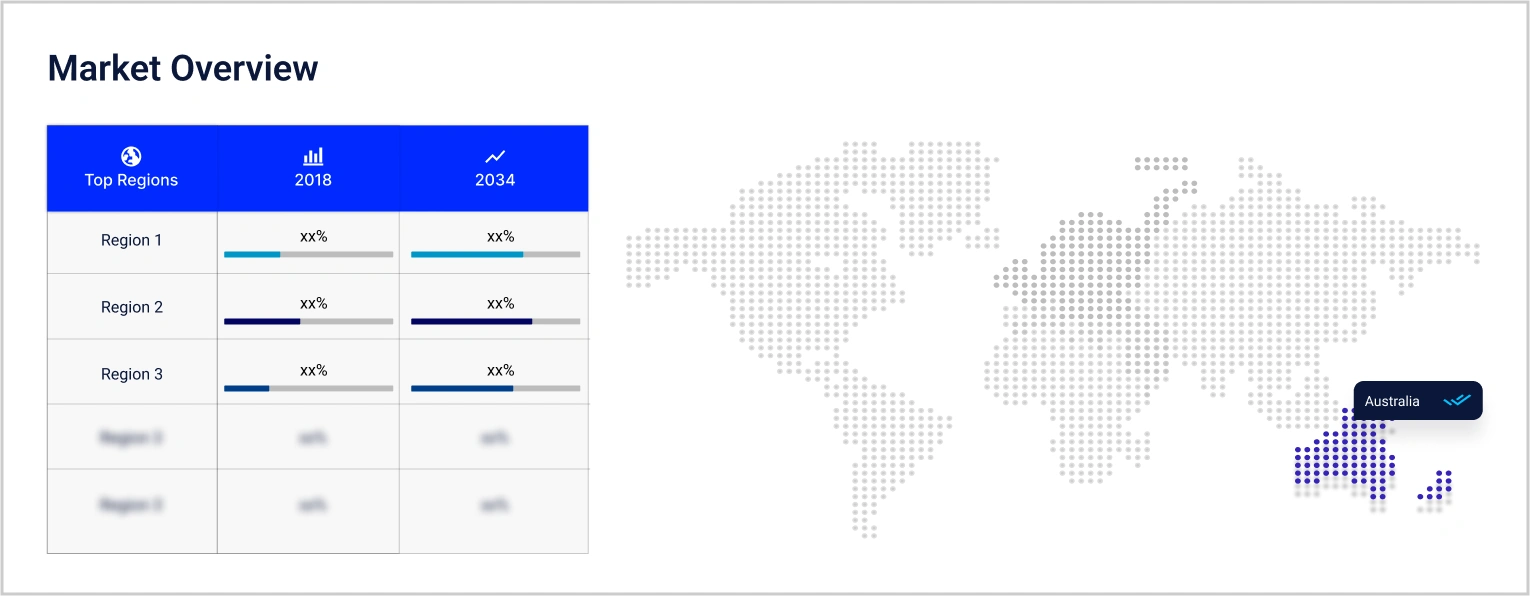
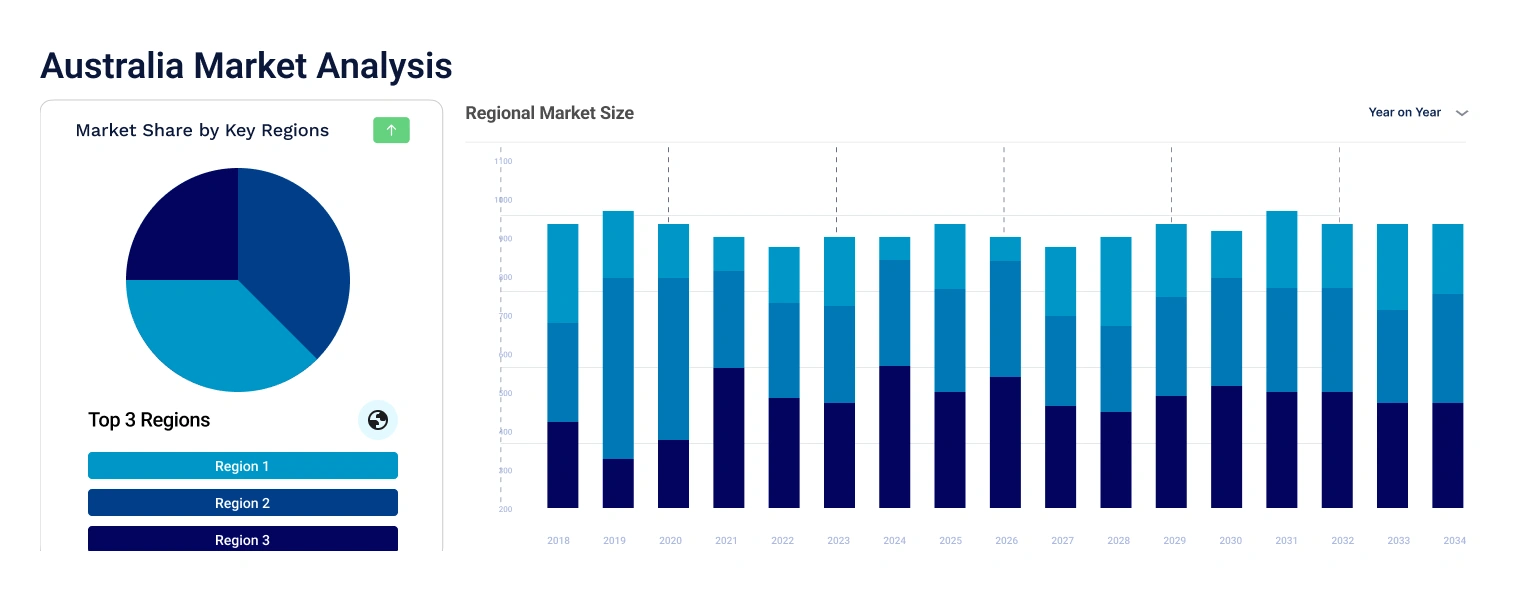
*this image is indicative*
Paid apps led the Australia online adventure games market share by providing a comprehensive, ad-free gaming experience
Players frequently opt for paid options to speed up game advancement, particularly advantageous for those with time constraints. Paid apps may sometimes provide free trials, enabling players to sample games before buying.
In-app purchases provide unique items, levels, and skills, improving gameplay. Some users expedite progress, which is beneficial for limited playtime. Customization choices and competitive advantages from purchases enhance the overall player experience.
As per the Australian government's Department of Foreign Affairs and Trade, Australia's gaming industry is expanding. In 2021, it generated USD 226.5 million in revenue, marking a 22% rise from 2020. Notably, 83% of this revenue originated from the international markets.
According to the Australia Interactive Games and Entertainment Association, there were 1,327 full-time employees in Australian game development studios in 2021 thus boosting the Australia online adventure games market.
According to the Australia Bureau of Statistics, the largest source of income for digital game development businesses was multiplatform end-to-end digital game development income, totalling $181.6 million.
"Australia Online Adventure Games Market Report and Forecast 2026-2035" offers a detailed analysis of the market based on the following segments:
Market Breakup by Type
Market Breakup by Region
The Australia online adventure games market key players are:


Upto 15% Off
USD
$2499 $2249
$3999 $3599
$4999 $4249
$5999 $5099


*While we strive to always give you current and accurate information, the numbers depicted on the website are indicative and may differ from the actual numbers in the main report. At Expert Market Research, we aim to bring you the latest insights and trends in the market. Using our analyses and forecasts, stakeholders can understand the market dynamics, navigate challenges, and capitalize on opportunities to make data-driven strategic decisions.*
Get in touch with us for a customized solution tailored to your unique requirements and save upto 35%!
The market is projected to grow at a CAGR of 6.02% between 2026 and 2035.
The online adventure games market is categorised according to its type, which includes paid apps, advertising, and in-app purchases.
The key players are Electronic Arts Inc., Square Enix, Nintendo Australia Pty, Activision Publishing Inc., and Tin Man Games Ltd. among others.
The market is broken down into New South Wales, Victoria, Queensland, Australian Capital Territory, Western Australia, and others.
Explore our key highlights of the report and gain a concise overview of key findings, trends, and actionable insights that will empower your strategic decisions.
| REPORT FEATURES | DETAILS |
| Base Year | 2025 |
| Historical Period | 2019-2025 |
| Forecast Period | 2026-2035 |
| Scope of the Report |
Historical and Forecast Trends, Industry Drivers and Constraints, Historical and Forecast Market Analysis by Segment:
|
| Breakup by Type |
|
| Breakup by Region |
|
| Market Dynamics |
|
| Competitive Landscape |
|
| Companies Covered |
|
Datasheet
One User
USD 2,499
USD 2,249
tax inclusive*
Single User License
One User
USD 3,999
USD 3,599
tax inclusive*
Five User License
Five User
USD 4,999
USD 4,249
tax inclusive*
Corporate License
Unlimited Users
USD 5,999
USD 5,099
tax inclusive*
*Please note that the prices mentioned below are starting prices for each bundle type. Kindly contact our team for further details.*
Flash Bundle
Small Business Bundle
Growth Bundle
Enterprise Bundle
*Please note that the prices mentioned below are starting prices for each bundle type. Kindly contact our team for further details.*
Flash Bundle
Number of Reports: 3
20%
tax inclusive*
Small Business Bundle
Number of Reports: 5
25%
tax inclusive*
Growth Bundle
Number of Reports: 8
30%
tax inclusive*
Enterprise Bundle
Number of Reports: 10
35%
tax inclusive*
How To Order

Select License Type
Choose the right license for your needs and access rights.

Click on ‘Buy Now’
Add the report to your cart with one click and proceed to register.

Select Mode of Payment
Choose a payment option for a secure checkout. You will be redirected accordingly.
Gain insights to stay ahead and seize opportunities.

Get insights & trends for a competitive edge.

Track prices with detailed trend reports.

Analyse trade data for supply chain insights.

Leverage cost reports for smart savings

Enhance supply chain with partnerships.

Connect For More Information
Our expert team of analysts will offer full support and resolve any queries regarding the report, before and after the purchase.
Our expert team of analysts will offer full support and resolve any queries regarding the report, before and after the purchase.
We employ meticulous research methods, blending advanced analytics and expert insights to deliver accurate, actionable industry intelligence, staying ahead of competitors.
Our skilled analysts offer unparalleled competitive advantage with detailed insights on current and emerging markets, ensuring your strategic edge.
We offer an in-depth yet simplified presentation of industry insights and analysis to meet your specific requirements effectively.


Share