

Consumer Insights
Uncover trends and behaviors shaping consumer choices today
Procurement Insights
Optimize your sourcing strategy with key market data
Industry Stats
Stay ahead with the latest trends and market analysis.
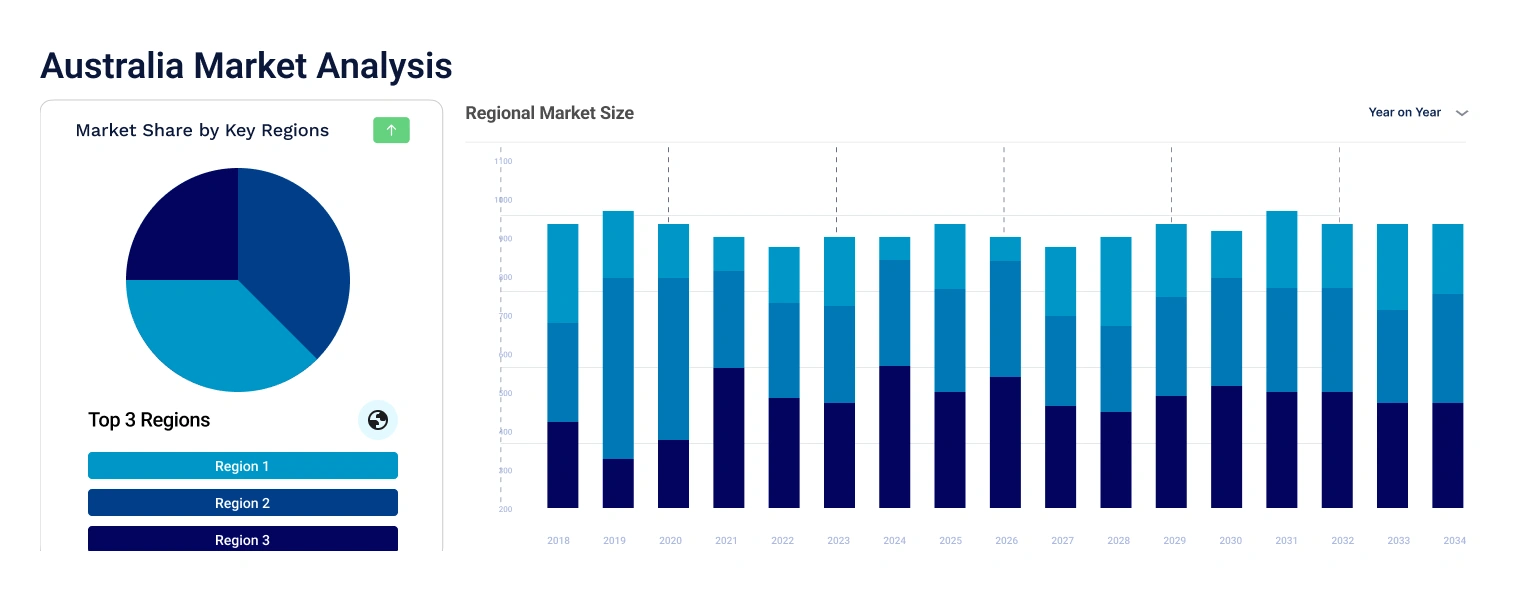
The Australia mobile gaming market size was valued at USD 970.68 Million in 2024. The market is further projected to grow at a CAGR of 7.10% between 2025 and 2034, reaching a value of USD 1927.40 Million by 2034.
Base Year
Historical Year
Forecast Year
As per industry reports, there are 918 active Australian mobile game developers on Google Play. Out of the 433,792 apps available on Google Play, 2,479 were built by Australian developers.
Australian mobile games have an average of 1.79 million downloads.
Some popular mobile games in Australia are Legend of Mushroom, Zen Word, Royal Match, MONOPOLY GO, and Lightning Link Casino Slots.


Value in USD Million
2025-2034
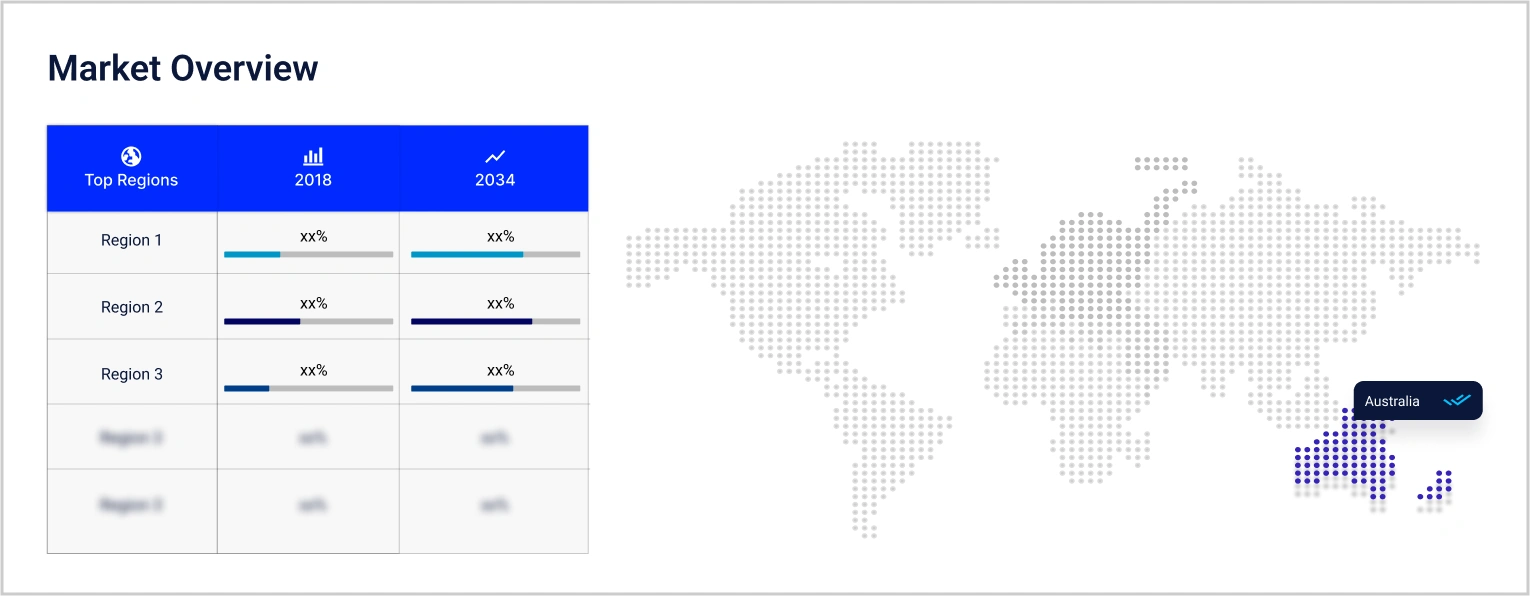
Australia Mobile Gaming Market Outlook
*this image is indicative*
The growing dependency on mobile devices for entertainment, rising number of gamers, attracted by the accessibility and affordability of mobile games compared to traditional gaming platforms, contributes to the Australia mobile gaming market growth. The Australia Plays 2023 report by the Interactive Games and Entertainment Association highlights a 14% increase in Australians playing video games.
The market is witnessing a diversification of game genres, with a wide range of games available on Android, iOS, and Windows devices. For example, popular games like "Among Us," "Fortnite," and "Candy Crush Saga" cater to different player preferences, from casual gamers to hardcore enthusiasts. This trend is impacting the market positively by driving higher downloads and in-game purchases.
Games like "Clash of Clans" and "Pokemon GO" utilise in-app purchases to enhance gameplay and generate revenue. Data shows that in-app purchases accounted for 48% of mobile gaming revenue in Australia in 2021, highlighting the effectiveness of this monetisation model.
Cloud gaming services like Google Stadia and NVIDIA GeForce Now are gaining traction in the Australia mobile gaming market, allowing players to stream high-quality games on their mobile devices. This trend offers convenience and flexibility to gamers, enabling them to access a vast library of games without the need for high-end hardware.
Games optimised for tablets like "Hearthstone" and "Minecraft" provide a visually appealing and engaging gaming experience. Data indicates that tablet gaming revenue in Australia reached USD 120 million in 2021. Smartphone gaming dominates the Australia mobile gaming market share, with popular titles like "Candy Crush Saga" and "Clash Royale" attracting a vast user base. Smartphone gaming revenue in Australia exceeded USD 500 million in 2021. The convenience and accessibility of smartphone gaming appeal to a broad audience, driving high engagement and revenue generation.
Australia Mobile Gaming Market Report and Forecast 2025-2034 offers a detailed analysis of the market based on the following segments:
Market Breakup by Type
Market Breakup by Platform Type
Market Breakup by Device Type
Market Breakup by Monetisation Type
Market Breakup by Region
Market players are focused on providing premium quality of mobile gaming across industries to stay ahead in the competition.
*While we strive to always give you current and accurate information, the numbers depicted on the website are indicative and may differ from the actual numbers in the main report. At Expert Market Research, we aim to bring you the latest insights and trends in the market. Using our analyses and forecasts, stakeholders can understand the market dynamics, navigate challenges, and capitalize on opportunities to make data-driven strategic decisions.*
Get in touch with us for a customized solution tailored to your unique requirements and save upto 35%!
In 2024, the market reached an approximate value of USD 970.68 Million.
The Australia mobile gaming market is expected to grow at a CAGR of 7.10% between 2025 and 2034.
The market is estimated to witness a healthy growth in the forecast period of 2025-2034 to reach USD 1927.40 Million by 2034.
The market is being driven due to growing smartphone penetration, the rising number of gamers, and affordability of mobile games compared to traditional gaming platforms.
Key trends aiding the market expansion include the increasing popularity of multiplayer and Massively Multiplayer Online (MMO) games, the dominance of the 25-34 age group in the market, the rise of adventure games, and the integration of advanced technologies like virtual reality (VR) and augmented reality (AR) in games.
Regions considered in the market are New South Wales, Victoria, Queensland, Western Australia, and Australian Capital Territory, among others.
Different type of devices in the market are tablet, smartphone, and PDA, among others.
Based on monetisation type, the market segmentations include advertising, in-app purchases, and paid apps.
The market can be classified by type into sports and role playing, action or adventure, strategy and brain, and casino.
Key players in this market include Chaos Theory Games Pty. Ltd., Virtua Technologies Pvt Ltd, PlaySide Studios Limited, Mode Games Pty Ltd, and Fgfactory Australia, among others.
Explore our key highlights of the report and gain a concise overview of key findings, trends, and actionable insights that will empower your strategic decisions.
| REPORT FEATURES | DETAILS |
| Base Year | 2024 |
| Historical Period | 2018-2024 |
| Forecast Period | 2025-2034 |
| Scope of the Report |
Historical and Forecast Trends, Industry Drivers and Constraints, Historical and Forecast Market Analysis by Segment:
|
| Breakup by Type |
|
| Breakup by Platform Type |
|
| Breakup by Device Type |
|
| Breakup by Monetisation Type |
|
| Breakup by Region |
|
| Market Dynamics |
|
| Competitive Landscape |
|
| Companies Covered |
|
Datasheet
One User
USD 2,499
USD 2,249
tax inclusive*
Single User License
One User
USD 3,999
USD 3,599
tax inclusive*
Five User License
Five User
USD 4,999
USD 4,249
tax inclusive*
Corporate License
Unlimited Users
USD 5,999
USD 5,099
tax inclusive*
*Please note that the prices mentioned below are starting prices for each bundle type. Kindly contact our team for further details.*
Flash Bundle
Small Business Bundle
Growth Bundle
Enterprise Bundle
*Please note that the prices mentioned below are starting prices for each bundle type. Kindly contact our team for further details.*
Flash Bundle
Number of Reports: 3
20%
tax inclusive*
Small Business Bundle
Number of Reports: 5
25%
tax inclusive*
Growth Bundle
Number of Reports: 8
30%
tax inclusive*
Enterprise Bundle
Number of Reports: 10
35%
tax inclusive*
How To Order
Our step-by-step guide will help you select, purchase, and access your reports swiftly, ensuring you get the information that drives your decisions, right when you need it.

Select License Type
Choose the right license for your needs and access rights.

Click on ‘Buy Now’
Add the report to your cart with one click and proceed to register.

Select Mode of Payment
Choose a payment option for a secure checkout. You will be redirected accordingly.
Gain insights to stay ahead and seize opportunities.

Get insights & trends for a competitive edge.

Track prices with detailed trend reports.

Analyse trade data for supply chain insights.

Leverage cost reports for smart savings

Enhance supply chain with partnerships.

Connect For More Information
Our expert team of analysts will offer full support and resolve any queries regarding the report, before and after the purchase.
Our expert team of analysts will offer full support and resolve any queries regarding the report, before and after the purchase.
We employ meticulous research methods, blending advanced analytics and expert insights to deliver accurate, actionable industry intelligence, staying ahead of competitors.
Our skilled analysts offer unparalleled competitive advantage with detailed insights on current and emerging markets, ensuring your strategic edge.
We offer an in-depth yet simplified presentation of industry insights and analysis to meet your specific requirements effectively.
Australia
63 Fiona Drive, Tamworth, NSW
+61-448-061-727
India
C130 Sector 2 Noida, Uttar Pradesh 201301
+91-723-689-1189
Philippines
40th Floor, PBCom Tower, 6795 Ayala Avenue Cor V.A Rufino St. Makati City,1226.
+63-287-899-028, +63-967-048-3306
United Kingdom
6 Gardner Place, Becketts Close, Feltham TW14 0BX, Greater London
+44-753-713-2163
United States
30 North Gould Street, Sheridan, WY 82801
+1-415-325-5166
Vietnam
193/26/4 St.no.6, Ward Binh Hung Hoa, Binh Tan District, Ho Chi Minh City
+84-865-399-124
United States (Head Office)
30 North Gould Street, Sheridan, WY 82801
+1-415-325-5166
Australia
63 Fiona Drive, Tamworth, NSW
+61-448-061-727
India
C130 Sector 2 Noida, Uttar Pradesh 201301
+91-723-689-1189
Philippines
40th Floor, PBCom Tower, 6795 Ayala Avenue Cor V.A Rufino St. Makati City, 1226.
+63-287-899-028, +63-967-048-3306
United Kingdom
6 Gardner Place, Becketts Close, Feltham TW14 0BX, Greater London
+44-753-713-2163
Vietnam
193/26/4 St.no.6, Ward Binh Hung Hoa, Binh Tan District, Ho Chi Minh City
+84-865-399-124


Share