

Consumer Insights
Uncover trends and behaviors shaping consumer choices today
Procurement Insights
Optimize your sourcing strategy with key market data
Industry Stats
Stay ahead with the latest trends and market analysis.
The Australia gaming accessories market size is projected to grow at a CAGR of 8.20% between 2025 and 2034.
Base Year
Historical Period
Forecast Period
In 2021, the Australian digital games industry contributed USD 226.5 million in revenue, marking a 22% increase from 2020.
As per industry reports, in 2018, consumer spending in the Australian video game industry surged to USD 4.029 billion, marking a substantial 25% increase from the previous year.
In 2019, the Interactive Games and Entertainment Association (IGEA) data reveals that total physical retail sales amounted to USD 1.179 billion, while digital sales soared to USD 2.851 billion, reflecting a notable 39% growth.
Physical retail sales, totalling USD 1.179 billion, saw a modest uptick of 0.2%, with console accessories sales notably rising by 19%.


Value in USD Billion
2025-2034
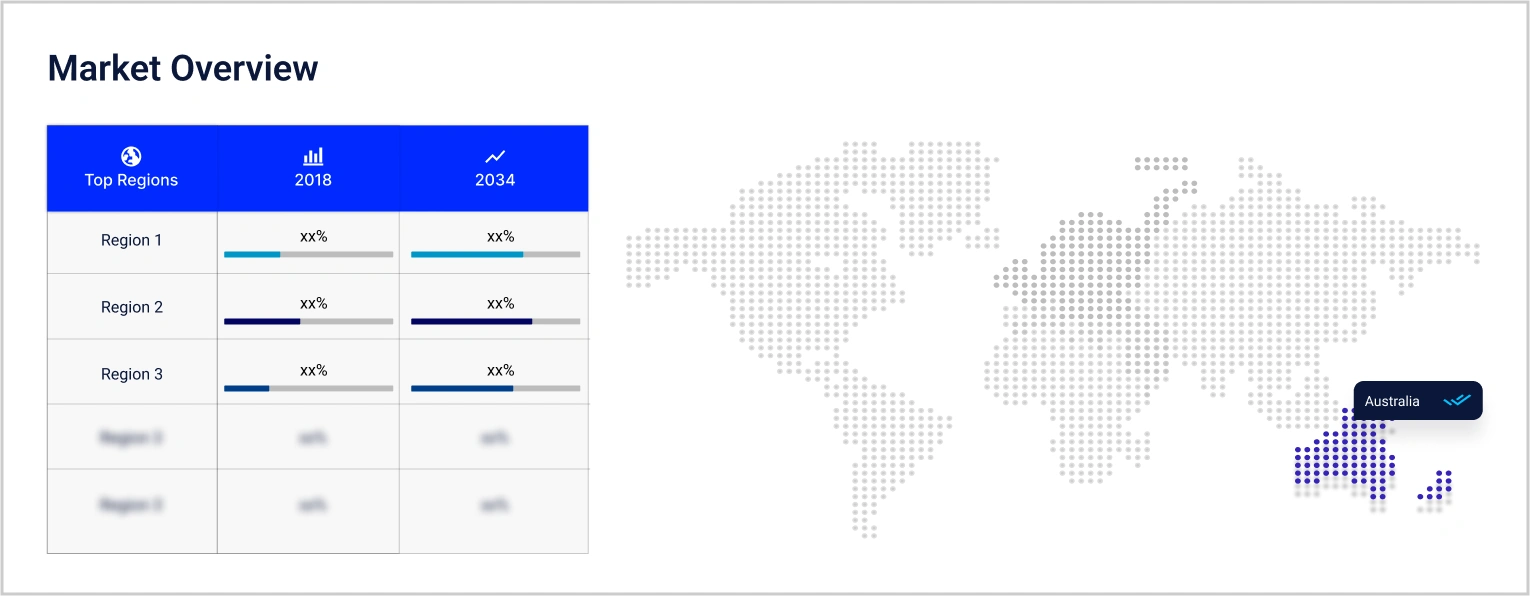
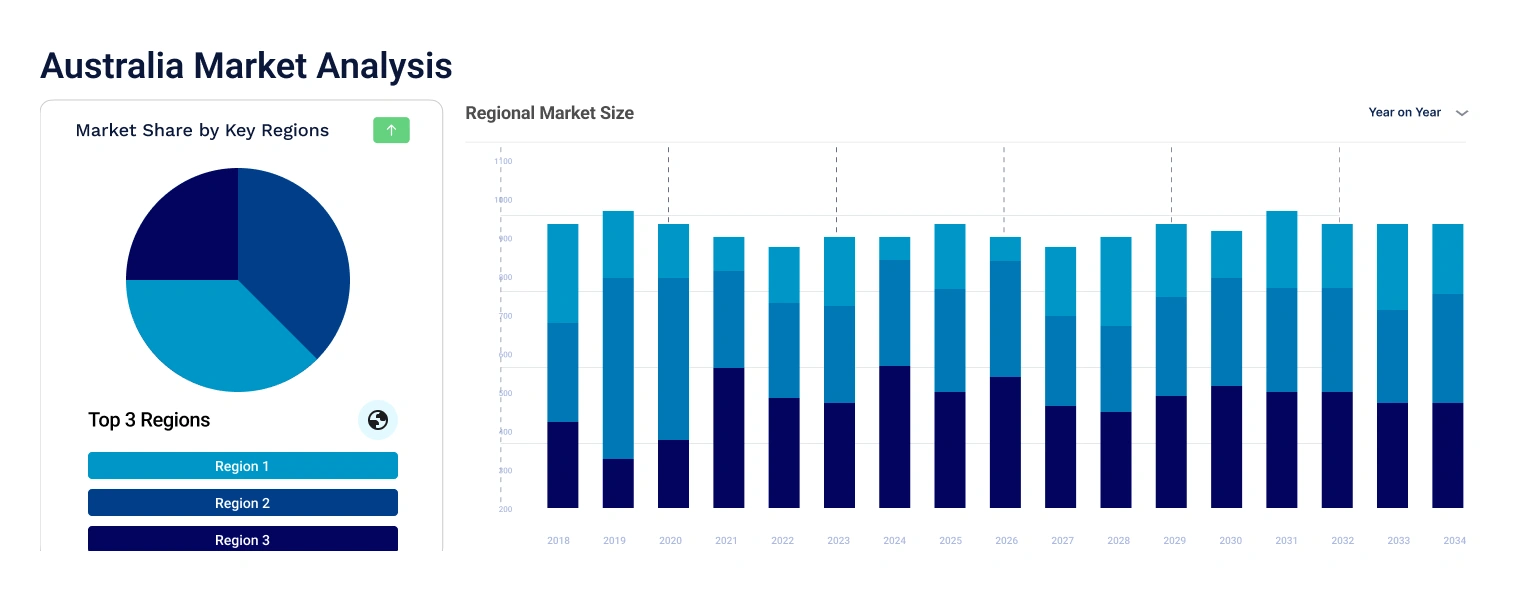
Australia Gaming Accessories Market Outlook
*this image is indicative*
The Australia gaming accessories market growth is primarily driven by the rise of esports leading to a surge in demand for high-performance gaming gear. Moreover, the growth in smartphone usage and the rapid development of technology further contribute to the expansion of the gaming accessories market in Australia, reflecting the evolving preferences of gamers. As per industry reports, mobile gaming remained a significant category within digital sales in 2019, showing an 11% increase in revenue.
The market is witnessing trend towards specialised gaming accessories with advanced features like ultraprecise optical sensors in gaming mice, shorter actuation distances on keyboard switches, and programmable controllers, meeting the need for speed, precision, and reliability in gaming. Additionally, the market is influenced by the increasing adoption of gaming consoles and PCs, the expansion of online gaming platforms, and the introduction of cutting-edge technologies like VR and 4K gaming, which drive the need for compatible accessories.
The wireless segment is gaining a larger Australia gaming accessories market share due to the convenience and freedom of movement it offers to gamers. Wireless gaming accessories, including joysticks, headsets, and mice, provide a clutter-free gaming experience and flexibility in positioning during gameplay. Leading brands like Logitech and Corsair offer a range of wireless gaming peripherals known for their reliability and performance.
On the other hand, the wired segment remains popular in the market, particularly among gamers who prioritise low latency and consistent connectivity. Wired gaming accessories ensure stable performance without concerns about battery life or signal interference, making them preferred for competitive gaming where split-second reactions are crucial. Brands like Razer and SteelSeries excel in offering high-quality wired gaming peripherals known for their durability and responsiveness, catering to gamers seeking uninterrupted gaming experience.
Australia Gaming Accessories Market Report and Forecast 2025-2034 offers a detailed analysis of the market based on the following segments
Market Breakup by Device Type
Market Breakup by Component Type
Market Breakup by Connectivity Type
Market Breakup by Distribution Channel
Market Breakup by Region
Market players are focused on enhancing the gaming experience, meeting the demands of gamers, and capitalising on technological advancements.
*While we strive to always give you current and accurate information, the numbers depicted on the website are indicative and may differ from the actual numbers in the main report. At Expert Market Research, we aim to bring you the latest insights and trends in the market. Using our analyses and forecasts, stakeholders can understand the market dynamics, navigate challenges, and capitalize on opportunities to make data-driven strategic decisions.*
Get in touch with us for a customized solution tailored to your unique requirements and save upto 35%!
The market is expected to grow at a CAGR of 8.20% between 2025 and 2034.
The market is being driven due to growing popularity of gaming and e-sports, the focus on product innovation, and the rising disposable income allowing consumers to invest in high-quality gaming accessories.
Key trends aiding the market expansion include growing demand for advanced gaming peripherals like headsets, mice, controllers, and keyboards, increasing adoption of gaming consoles and PCs, and the introduction of cutting-edge technologies like VR and 4K gaming.
Regions considered in the market are New South Wales, Victoria, Queensland, Western Australia, and Australian Capital Territory, among others.
Based on component type, the market segmentations include joysticks, headsets, and mice, among others.
Gaming console, PC, and smartphones are considered in the report.
Key players in the market include Dell Inc., Logitech International S.A., Turtle Beach Corporation, HP Inc., and NZXT Inc., among others.
Explore our key highlights of the report and gain a concise overview of key findings, trends, and actionable insights that will empower your strategic decisions.
| REPORT FEATURES | DETAILS |
| Base Year | 2024 |
| Historical Period | 2018-2024 |
| Forecast Period | 2025-2034 |
| Scope of the Report |
Historical and Forecast Trends, Industry Drivers and Constraints, Historical and Forecast Market Analysis by Segment:
|
| Breakup by Device Type |
|
| Breakup by Component Type |
|
| Breakup by Connectivity Type |
|
| Breakup by Distribution Channel |
|
| Breakup by Region |
|
| Market Dynamics |
|
| Competitive Landscape |
|
| Companies Covered |
|
Single User License
One User
USD 3,999
USD 3,599
tax inclusive*
Datasheet
One User
USD 2,499
USD 2,249
tax inclusive*
Five User License
Five User
USD 4,999
USD 4,249
tax inclusive*
Corporate License
Unlimited Users
USD 5,999
USD 5,099
tax inclusive*
*Please note that the prices mentioned below are starting prices for each bundle type. Kindly contact our team for further details.*
Flash Bundle
Small Business Bundle
Growth Bundle
Enterprise Bundle
*Please note that the prices mentioned below are starting prices for each bundle type. Kindly contact our team for further details.*
Flash Bundle
Number of Reports: 3
20%
tax inclusive*
Small Business Bundle
Number of Reports: 5
25%
tax inclusive*
Growth Bundle
Number of Reports: 8
30%
tax inclusive*
Enterprise Bundle
Number of Reports: 10
35%
tax inclusive*
How To Order
Our step-by-step guide will help you select, purchase, and access your reports swiftly, ensuring you get the information that drives your decisions, right when you need it.

Select License Type
Choose the right license for your needs and access rights.

Click on ‘Buy Now’
Add the report to your cart with one click and proceed to register.

Select Mode of Payment
Choose a payment option for a secure checkout. You will be redirected accordingly.
Track prices with detailed trend reports.

Analyse trade data for supply chain insights.

Leverage cost reports for smart savings

Enhance supply chain with partnerships.

Gain insights to stay ahead and seize opportunities.

Get insights & trends for a competitive edge.

Track prices with detailed trend reports.
Analyse trade data for supply chain insights.
Leverage cost reports for smart savings
Enhance supply chain with partnerships.
Gain insights to stay ahead and seize opportunities.
Get insights & trends for a competitive edge.
Track prices with detailed trend reports.
Analyse trade data for supply chain insights.
Connect For More Information
Our expert team of analysts will offer full support and resolve any queries regarding the report, before and after the purchase.
Our expert team of analysts will offer full support and resolve any queries regarding the report, before and after the purchase.
We employ meticulous research methods, blending advanced analytics and expert insights to deliver accurate, actionable industry intelligence, staying ahead of competitors.
Our skilled analysts offer unparalleled competitive advantage with detailed insights on current and emerging markets, ensuring your strategic edge.
We offer an in-depth yet simplified presentation of industry insights and analysis to meet your specific requirements effectively.
Australia
63 Fiona Drive, Tamworth, NSW
+61-448-061-727
India
C130 Sector 2 Noida, Uttar Pradesh 201301
+91-723-689-1189
Philippines
40th Floor, PBCom Tower, 6795 Ayala Avenue Cor V.A Rufino St. Makati City,1226.
+63-287-899-028, +63-967-048-3306
United Kingdom
6 Gardner Place, Becketts Close, Feltham TW14 0BX, Greater London
+44-753-713-2163
United States
30 North Gould Street, Sheridan, WY 82801
+1-415-325-5166
Vietnam
193/26/4 St.no.6, Ward Binh Hung Hoa, Binh Tan District, Ho Chi Minh City
+84-865-399-124
United States (Head Office)
30 North Gould Street, Sheridan, WY 82801
+1-415-325-5166
Australia
63 Fiona Drive, Tamworth, NSW
+61-448-061-727
India
C130 Sector 2 Noida, Uttar Pradesh 201301
+91-723-689-1189
Philippines
40th Floor, PBCom Tower, 6795 Ayala Avenue Cor V.A Rufino St. Makati City, 1226.
+63-287-899-028, +63-967-048-3306
United Kingdom
6 Gardner Place, Becketts Close, Feltham TW14 0BX, Greater London
+44-753-713-2163
Vietnam
193/26/4 St.no.6, Ward Binh Hung Hoa, Binh Tan District, Ho Chi Minh City
+84-865-399-124


Share