Explore Our Diverse Range Of Offerings
From detailed reports to experts services offered in 15+ Industry Domains
Report
Press Release
Blogs
Industry Statistics
Add 2 More Reports For 20% off

Report Overview

2024

Base Year

2018-2024

Historical Year

2025-2034

Forecast Year

Australia Digital Signage Market Outlook

The Australia digital signage market size was valued at USD 324.3 million in 2024. The market is further projected to grow at a CAGR of 5.4% between 2025 and 2034, reaching a value of USD 525 million by 2034.

Key Takeaways

  • As per industry reports, the market is being driven by the adoption of cloud-based digital signage software by Australian SMEs due to its ease of use and cost-effectiveness.
  • Digital signage is being used in various ways by different industries, with retail and restaurant locations using it for advertising, while corporate, medical, and educational companies use digital signage systems to spread important information.
  • The future of digital signage in Australia is expected to be shaped by technological advancements such as artificial intelligence (AI), virtual and augmented reality (VR and AR), facial recognition, social media integrations, and AI & machine learning.

One of the key trends accelerating the Australia digital signage market development is the increasing adoption of interactive digital signage, which allows consumers to engage with the content and receive real-time information. This can range from touch screens to gesture control and even voice recognition. Another trend is the integration of artificial intelligence (AI) and data analytics into digital signage, which allows for better targeting and personalisation of content, leading to improved customer engagement.

The surge in outdoor digital signage, has proven to be a valuable communication tool for businesses, especially in facilitating contactless interactions like ordering and displaying promotions. Moreover, the growing demand for ultra-large screens, driven by businesses preferring larger displays for both indoor and outdoor applications, along with advancements in video wall and OLED technology, is contributing to Australia digital signage market growth. The proliferation of Software-as-a-Service (SaaS) and managed services in the digital signage sector is also a significant trend, offering cloud-hosted subscription-based solutions and value-added services like content creation and management.

The healthcare industry in Australia is increasingly adopting digital signage to display information about services, facilities, and appointments, reducing the need for manual updates and improving the overall patient experience. The market for digital signage in the healthcare sector is expected to grow due to the increasing demand for efficient and interactive communication systems.

Sport stadiums use digital signage to provide real-time information about events, scores, and schedules, improving the overall fan experience. Meanwhile, the entertainment industry, including cinema chains use digital signage to provide real-time information about movies, showtimes, and promotions, improving the overall fan experience.

Market Segmentation

Australia Digital Signage Market Report and Forecast 2025-2034 offers a detailed analysis of the market based on the following segments:

Market Breakup by Type

  • Video Screen
  • Digital Poster
  • Video Walls
  • Transparent LED Screen
  • Kiosks
  • Others

Market Breakup by Content Category

  • Non-broadcast
  • Broadcast
    • Sports
    • News
    • Weather
    • Others

Market Breakup by Technology

  • Projection
  • LCD
  • LED
  • Others

Market Breakup by Component

  • Software
  • Hardware
  • Service

Market Breakup by Location

  • Outdoor
  • Indoor

Market Breakup by Screen Size

  • Below 32 Inches
  • 32 to 52 Inches
  • More than 52 Inches

Market Breakup by Enterprise Size

  • Small Office/Home Office (SOHO)
  • Small and Medium-sized Enterprise (SMEs)
  • Large Enterprises

Market Breakup by Application

  • Healthcare
  • Transport
  • Stadiums and Playgrounds
  • Hospitality
  • Corporate
  • Banking
  • Retail
  • Entertainment
  • Education
  • Others

Market Breakup by Region

  • New South Wales
  • Victoria
  • Queensland
  • Australian Capital Territory
  • Western Australia
  • Others

Competitive Landscape

Market players are capitalising on the growing demand for digital signage solutions, which are being increasingly adopted by various industries.

  • LG Electronics Australia Pty Limited
  • Panasonic Australia Pty Limited
  • Signtronics Australia
  • Samsung Electronics Australia Pty Limited
  • Sony Electronics Asia Pacific Pte. Ltd.
  • Toshiba (Australia) Pty Limited
  • Icon Creations Pty Ltd. 
  • Others

Key Highlights of the Report

REPORT FEATURES DETAILS
Base Year 2023
Historical Period 2018-2024
Forecast Period 2025-2034
Scope of the Report

Historical and Forecast Trends, Industry Drivers and Constraints, Historical and Forecast Market Analysis by Segment:

  • Type
  • Content Category
  • Technology
  • Component
  • Location
  • Screen Size
  • Enterprise Size
  • Application
  • Region
Breakup by Type
  • Video Screen
  • Digital Poster
  • Video Walls
  • Transparent LED Screen
  • Kiosks
  • Others
Breakup by Content Category
  • Non-broadcast
  • Broadcast
Breakup by Technology
  • Projection
  • LCD
  • LED
  • Others
Breakup by Component
  • Software
  • Hardware
  • Service
Breakup by Location
  • Outdoor
  • Indoor
Breakup by Screen Size
  • Below 32 Inches
  • 32 to 52 Inches
  • More than 52 Inches
Breakup by Enterprise Size
  • Small Office/Home Office (SOHO) 
  • Small and Medium-sized Enterprise (SMEs)
  • Large Enterprises
Breakup by Application
  • Healthcare 
  • Transport
  • Stadiums and Playgrounds
  • Hospitality
  • Corporate
  • Banking
  • Retail
  • Entertainment
  • Education
  • Others
Breakup by Region
  • New South Wales
  • Victoria
  • Queensland
  • Australian Capital Territory
  • Western Australia
  • Others
Market Dynamics
  • SWOT Analysis
  • Porter's Five Forces Analysis
  • Key Indicators for Demand
  • Key Indicators for Price
Competitive Landscape
  • Market Structure
  • Company Profiles
    • Company Overview
    • Product Portfolio
    • Demographic Reach and Achievements
    • Certifications
Companies Covered
  • LG Electronics Australia Pty Limited 
  • Panasonic Australia Pty Limited 
  • Signtronics Australia  
  • Samsung Electronics Australia Pty Limited 
  • Sony Electronics Asia Pacific Pte. Ltd. 
  • Toshiba (Australia) Pty Limited 
  • Icon Creations Pty Ltd.  
  • Others

*While we strive to always give you current and accurate information, the numbers depicted on the website are indicative and may differ from the actual numbers in the main report. At Expert Market Research, we aim to bring you the latest insights and trends in the market. Using our analyses and forecasts, stakeholders can understand the market dynamics, navigate challenges, and capitalize on opportunities to make data-driven strategic decisions.*

Looking for specific insights?

Get in touch with us for a customized solution tailored to your unique requirements and save upto 35%!

Key Questions Answered in the Report

In 2024, the market reached an approximate value of USD 324.3 million.

The market is expected to grow at a CAGR of 5.4% between 2025 and 2034.

The market is estimated to witness a healthy growth in the forecast period of 2025-2034 to reach USD 525 million by 2034.

The market is being driven due to technological advancements, increased adoption of digital marketing strategies by businesses, and a growing demand for interactive and engaging content.

Key trends aiding the market expansion include increasing adoption of interactive digital signage, emergence of cloud-based digital signage solutions, and demand for digital signage solutions in the retail industry.

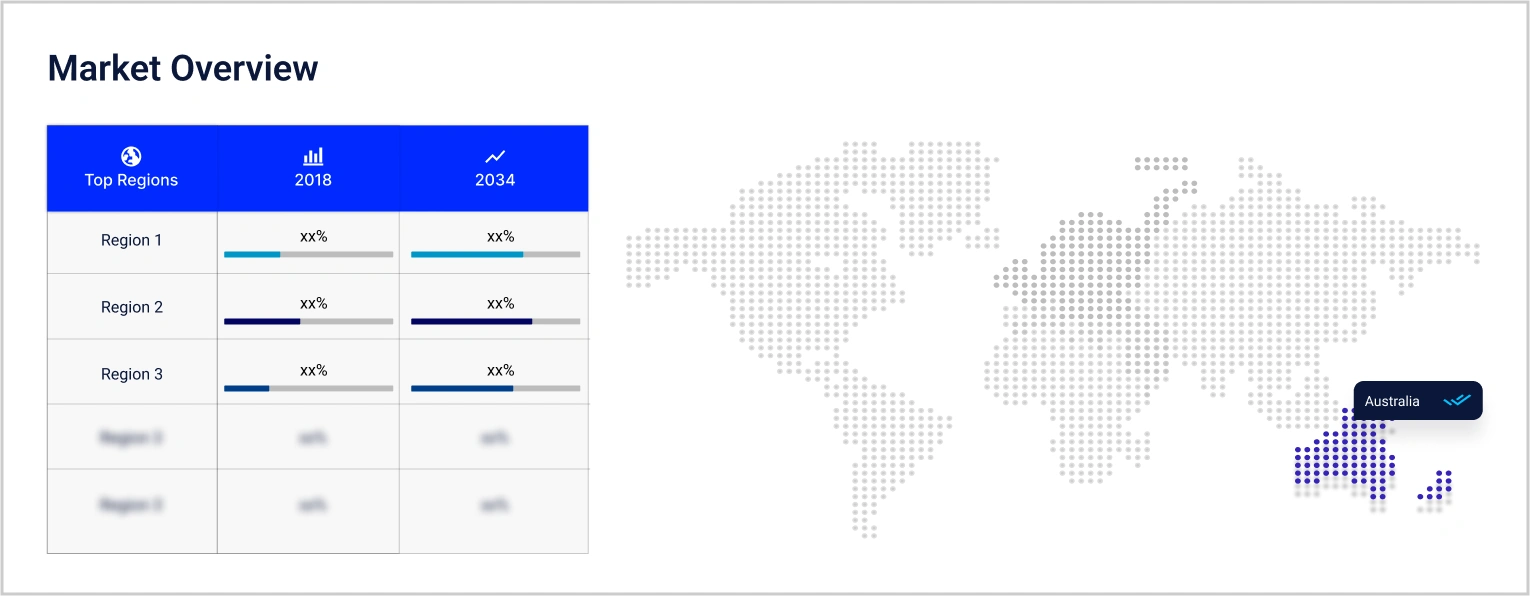
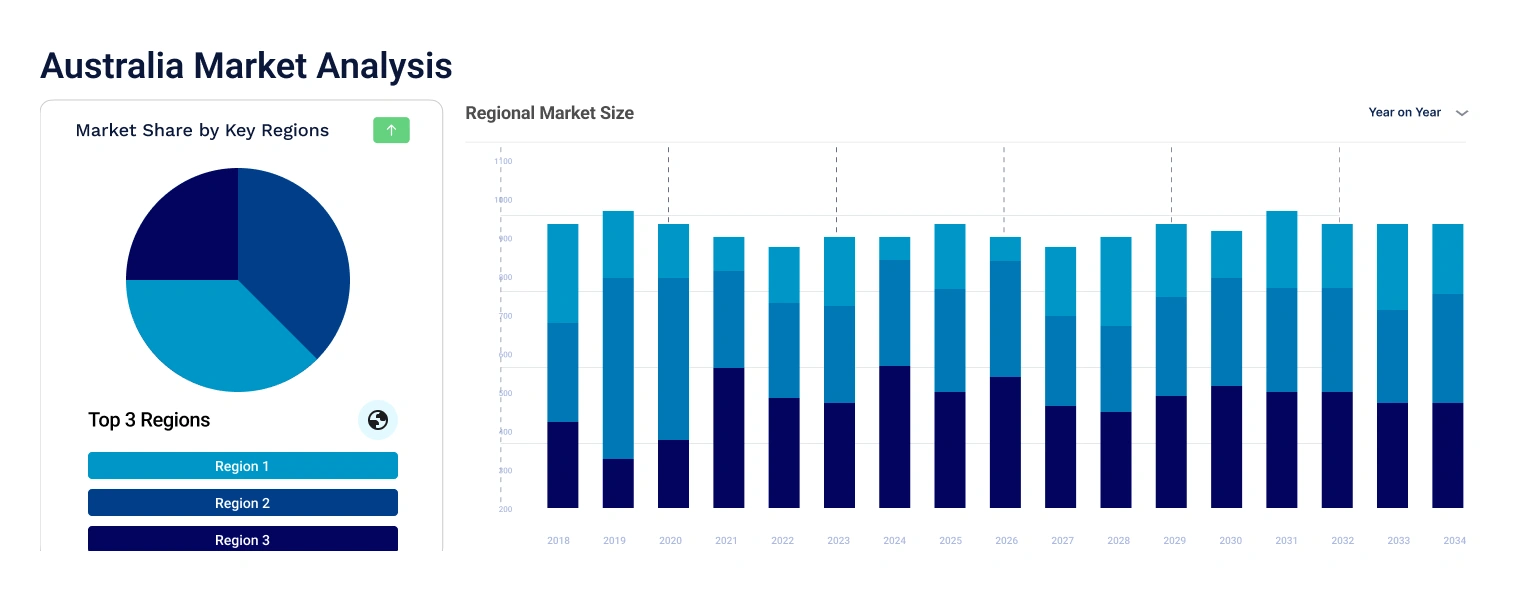
Regions considered in the market are New South Wales, Victoria, Queensland, Western Australia, and Australian Capital Territory, among others.

Different applications of digital signage are healthcare, transport, stadiums and playgrounds, hospitality, corporate, banking, retail, entertainment, and education, among others.

Based on content category, the market segmentations include non-broadcast and broadcast. Broadcast further includes sports, news, weather.

Video screen, digital poster, video walls, transparent LED screen, kiosks, and other types are considered in the report.

Key players in the market are LG Electronics Australia Pty Limited, Panasonic Australia Pty Limited, Signtronics Australia, Samsung Electronics Australia Pty Limited, Sony Electronics Asia Pacific Pte. Ltd., Toshiba (Australia) Pty Limited, and Icon Creations Pty Ltd., among others.

Datasheet

10 % Off

USD

2,499

2,249

Single User License

10 % Off

USD

3,999

3,599

Five User License

15 % Off

USD

4,999

4,249

Corporate License

15 % Off

USD

5,999

5,099

  • Report Delivery
  • Purchase Advantages
  • Access Duration
  • Analyst Support
  • Discount on Future Updates
  • Customisation Options
  • Customisation Requests
  • Excel Data Sheet
  • Online Access
  • PDF Format
  • PPT/Word Format
  • 1 Print Allowed
  • Bulk Purchase Discounts
  • Full Report Access
  • Multi-Device Access
  • Unlimited Access
  • One-Time Purchase
  • 3-Month Trade Data Access
  • Consultation Hours
  • Email Support
  • Phone Support
  • Up to 15 Analyst Hours
  • Up to 30 Analyst Hours
  • 5% Discount
  • 10% Discount
  • 15% Discount
  • 20% Discount
  • Basic (Up to 10%)
  • Advanced (Up to 50%)
  • Dedicated Analyst Access
  • Data Visualization Access
  • Custom Data Queries
  • Custom Report Layouts
  • Tailored Custom Summaries
  • Dashboard
  • Purchase Advantages
  • Report Delivery
  • Access Duration
  • Analyst Support
  • Discount on Future Updates
  • Customisation Options
  • Customisation Requests
  • 1 Print Allowed
  • Full Report Access
  • Bulk Purchase Discounts
  • Multi-Device Access
  • PDF Format
  • Online Access
  • Excel Data Sheet
  • PPT/Word Format
  • Unlimited Access
  • One-Time Purchase
  • 3-Month Trade Data Access
  • Consultation Hours
  • Email Support
  • Phone Support
  • Up to 15 Analyst Hours
  • Up to 30 Analyst Hours
  • 5% Discount
  • 10% Discount
  • 15% Discount
  • 20% Discount
  • Basic (Up to 10%)
  • Advanced (Up to 50%)
  • Dedicated Analyst Access
  • Data Visualization Access
  • Custom Data Queries
  • Custom Report Layouts
  • Tailored Custom Summaries
  • Dashboard
  • Purchase Advantages
  • Analyst Support
  • Report Delivery
  • Access Duration
  • Customisation Options
  • Discount on Future Updates
  • Customisation Requests
  • 5 Prints Allowed
  • Full Report Access
  • Bulk Purchase Discounts
  • Limited Device Access
  • Email Support
  • Phone Support
  • Up to 15 Analyst Hours
  • Up to 30 Analyst Hours
  • PDF Format
  • Online Access
  • Excel Data Sheet
  • PPT/Word Format
  • Unlimited Access
  • One-Time Purchase
  • 3-Month Trade Data Access
  • Consultation Hours
  • Basic (Up to 10%)
  • Advanced (Up to 50%)
  • Dedicated Analyst Access
  • Data Visualization Access
  • 5% Discount
  • 10% Discount
  • 15% Discount
  • 20% Discount
  • Custom Data Queries
  • Custom Report Layouts
  • Tailored Custom Summaries
  • Dashboard
  • Report Delivery
  • Purchase Advantages
  • Customisation Options
  • Customisation Requests
  • Analyst Support
  • Access Duration
  • Discount on Future Updates
  • PDF Format
  • Excel Data Sheet
  • PPT/Word Format
  • Online Access
  • Unlimited Prints Available
  • Full Report Access
  • Bulk Purchase Discounts
  • Multi-Device Access
  • Basic (Up to 10%)
  • Advanced (Up to 50%)
  • Dedicated Analyst Access
  • Data Visualization Access
  • Custom Data Queries
  • Custom Report Layouts
  • Tailored Custom Summaries
  • Dashboard
  • Email Support
  • Phone Support
  • Up to 15 Analyst Hours
  • Up to 30 Analyst Hours
  • Unlimited Access
  • One-Time Purchase
  • 3-Month Trade Data Access
  • Consultation Hours
  • 5% Discount
  • 10% Discount
  • 15% Discount
  • 20% Discount

Datasheet

One User

USD 2,499

USD 2,249

tax inclusive*

  • Selected Segments
  • Printing Restrictions
  • Excel Spreadsheet Delivered via Email
  • Full Report
  • Periodic Updates
  • Post Sales Analysts Support
  • Unlimited Prints

Single User License

One User

USD 3,999

USD 3,599

tax inclusive*

  • All Segments
  • Printing Restrictions
  • PDF Delivered via Email
  • Custom Report Layout
  • Post Sales Analysts Support
  • Periodic Updates
  • Unlimited Prints

Five User License

Five User

USD 4,999

USD 4,249

tax inclusive*

  • All Segments
  • Five Prints Available
  • PDF Delivered via Email
  • Limited Free Customization
  • Post Sales Analyst Support
  • Custom Report Layout
  • Periodic Updates
  • Unlimited Prints

Corporate License

Unlimited Users

USD 5,999

USD 5,099

tax inclusive*

  • All Segments
  • Unlimited Prints Available
  • PDF & Excel Delivery via Email
  • Limited Free Customization
  • Post Sales Analysts Support
  • Discount On Next Update
  • Custom Report Layout

*Please note that the prices mentioned below are starting prices for each bundle type. Kindly contact our team for further details.*

Bundle Type

Flash Bundle

20% OFF Number of Reports: 3

Small Business Bundle

25% OFF Number of Reports: 5

Growth Bundle

30% OFF Number of Reports: 8

Enterprise Bundle

35% OFF Number of Reports: 10
Overview
  • Life Time Access
  • Analyst Support Related to Report
  • PDF Version of the Report
  • Complimentary Excel Data Set
  • Free Analyst Hours
  • Complimentary Free 1 Month Subscription to Trade Data Base
  • Complimentary One Month Subscription to Price Database (Chemicals only)
  • Complementary PPT Version of the Report
  • Complimentary License Upgrade
  • Complimentary Power BI Dashboards
  • Life Time Access
  • Analyst Support Related to Report
  • PDF Version of the Report
  • Complimentary Excel Data Set
  • Free Analyst Hours - 50 Hours
  • Complimentary Free 1 Month Subscription to Trade Data Base
  • Complimentary One Month Subscription to Price Database (Chemicals only)
  • Complementary PPT Version of the Report
  • Complimentary License Upgrade
  • Complimentary Power BI Dashboards
  • Life Time Access
  • Analyst Support Related to Report
  • PDF Version of the Report
  • Complimentary Excel Data Set
  • Free Analyst Hours - 80 Hours
  • Complimentary Free 1 Month Subscription to Trade Data Base
  • Complimentary One Month Subscription to Price Database (Chemicals only)
  • Complementary PPT Version of the Report
  • Complimentary License Upgrade
  • Complimentary Power BI Dashboards
  • Life Time Access
  • Analyst Support Related to Report
  • PDF Version of the Report
  • Complimentary Excel Data Set
  • Free Analyst Hours - 100 Hours
  • Complimentary Free 1 Month Subscription to Trade Data Base
  • Complimentary One Month Subscription to Price Database (Chemicals only)
  • Complementary PPT Version of the Report
  • Complimentary License Upgrade
  • Complimentary Power BI Dashboards

*Please note that the prices mentioned below are starting prices for each bundle type. Kindly contact our team for further details.*

Flash Bundle

Number of Reports: 3

20%

tax inclusive*

  • 3 Reports Included
  • Life Time Acess
  • Analyst Support Related to Report
  • PDF Version of the Report
  • Free 1 Month Subscription to Trade Data Base
  • 1 Month Subscription to Price Database (Chemicals only)
  • Complimentary Excel Data Set
  • PPT Version of the Report
  • Power BI Dashboards
  • License Upgrade
  • Free Analyst Hours

Small Business Bundle

Number of Reports: 5

25%

tax inclusive*

  • 5 Reports Included
  • Life Time Acess
  • Analyst Support Related to Report
  • PDF Version of the Report
  • Complimentary Excel Data Set
  • Free Analyst Hours - 50 Hours
  • Free 1 Month Subscription to Trade Data Base
  • 1 Month Subscription to Price Database (Chemicals only)
  • Complimentary Excel Data Set
  • PPT Version of the Report
  • Power BI Dashboards
  • License Upgrade

Growth Bundle

Number of Reports: 8

30%

tax inclusive*

  • 8 Reports Included
  • Life Time Acess
  • Analyst Support Related to Report
  • PDF Version of the Report
  • Complimentary Excel Data Set
  • Free Analyst Hours - 50 Hours
  • Free 1 Month Subscription to Trade Data Base
  • 1 Month Subscription to Price Database (Chemicals only)
  • License Upgrade
  • Free Analyst Hours - 80 Hours
  • Power BI Dashboards

Enterprise Bundle

Number of Reports: 10

35%

tax inclusive*

  • 10 Reports Included
  • Life Time Acess
  • Analyst Support Related to Report
  • PDF Version of the Report
  • Complimentary Excel Data Set
  • Free Analyst Hours - 50 Hours
  • Free 1 Month Subscription to Trade Data Base
  • 1 Month Subscription to Price Database (Chemicals only)
  • License Upgrade
  • Power BI Dashboards
  • Free Analyst Hours - 100 Hours

How To Order

Our step-by-step guide will help you select, purchase, and access your reports swiftly, ensuring you get the information that drives your decisions, right when you need it.

Select License Type

Choose the right license for your needs and access rights.

Click on ‘Buy Now’

Add the report to your cart with one click and proceed to register.

Select Mode of Payment

Choose a payment option for a secure checkout. You will be redirected accordingly.

Strategic Solutions for Informed Decision-Making

Connect For More Information

Our expert team of analysts will offer full support and resolve any queries regarding the report, before and after the purchase.

Our expert team of analysts will offer full support and resolve any queries regarding the report, before and after the purchase.

We employ meticulous research methods, blending advanced analytics and expert insights to deliver accurate, actionable industry intelligence, staying ahead of competitors.

Our skilled analysts offer unparalleled competitive advantage with detailed insights on current and emerging markets, ensuring your strategic edge.

We offer an in-depth yet simplified presentation of industry insights and analysis to meet your specific requirements effectively.

We’re here to help answer any questions about our products and services.

Contact us

Our Offices


Australia

63 Fiona Drive, Tamworth, NSW

+61-448-061-727

India

C130 Sector 2 Noida, Uttar Pradesh 201301

+91-723-689-1189

Philippines

40th Floor, PBCom Tower, 6795 Ayala Avenue Cor V.A Rufino St. Makati City,1226.

+63-287-899-028, +63-967-048-3306

United Kingdom

6 Gardner Place, Becketts Close, Feltham TW14 0BX, Greater London

+44-753-713-2163

United States

30 North Gould Street, Sheridan, WY 82801

+1-415-325-5166

Vietnam

193/26/4 St.no.6, Ward Binh Hung Hoa, Binh Tan District, Ho Chi Minh City

+84-865-399-124

30 North Gould Street, Sheridan, WY 82801

+1-415-325-5166

63 Fiona Drive, Tamworth, NSW

+61-448-061-727

C130 Sector 2 Noida, Uttar Pradesh 201301

+91-723-689-1189

40th Floor, PBCom Tower, 6795 Ayala Avenue Cor V.A Rufino St. Makati City, 1226.

+63-287-899-028, +63-967-048-3306

6 Gardner Place, Becketts Close, Feltham TW14 0BX, Greater London

+44-753-713-2163

193/26/4 St.no.6, Ward Binh Hung Hoa, Binh Tan District, Ho Chi Minh City

+84-865-399-124