

Consumer Insights
Uncover trends and behaviors shaping consumer choices today
Procurement Insights
Optimize your sourcing strategy with key market data
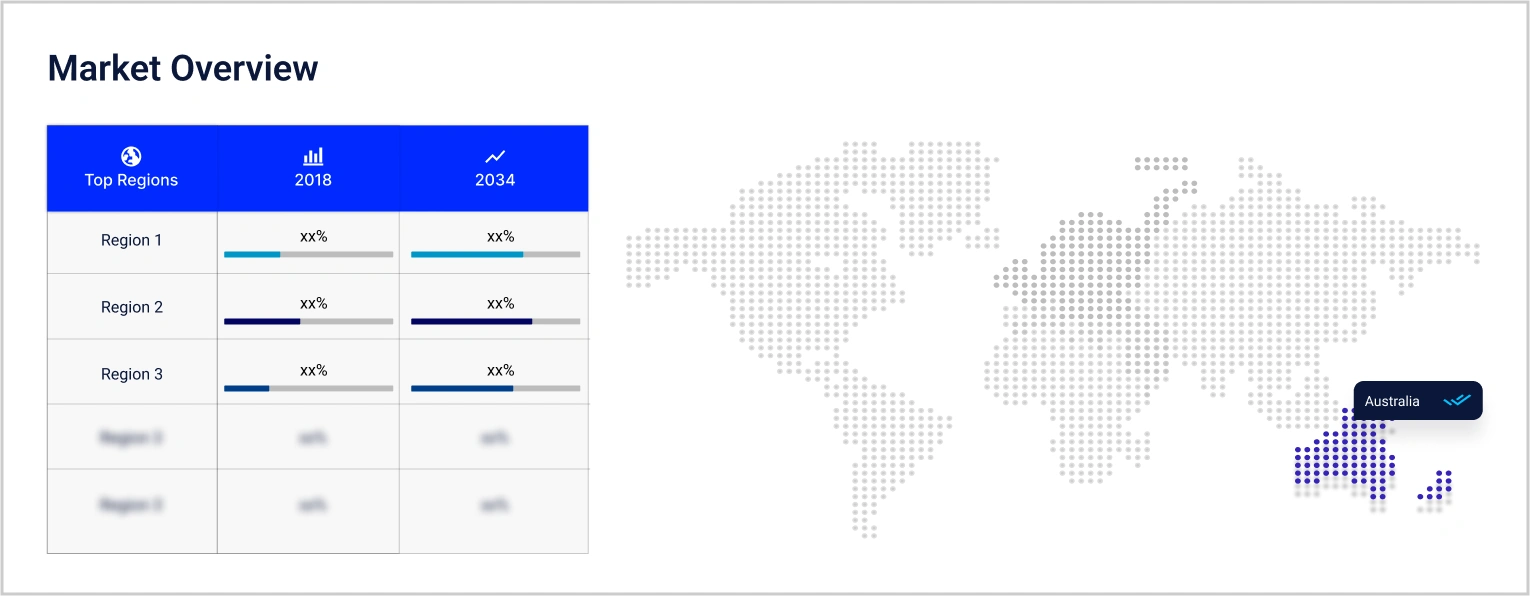
Industry Stats
Stay ahead with the latest trends and market analysis.

The Australia commercial real estate market size reached USD 36.56 Billion in 2025. The market is expected to grow at a CAGR of 7.90% between 2026 and 2035, reaching almost USD 78.20 Billion by 2035.
Base Year
Historical Period
Forecast Period
As reported by Commercial Real Estate, the value of investment-grade industrial property in Australia is projected to surpass that of office property for the first time by 2026. This shift is attributed to the rising values of logistics real estate, driven by the expansion of e-commerce and the construction of larger facilities to accommodate this growth.
According to the 2023 Institutional Real Estate Allocations Monitor, global institutional investors are expected to maintain target allocations to real estate at 10.8% in 2024.
As per industry reports, Asia Pacific-based investors, with the lowest real estate allocation among major regions, anticipate increasing their target allocation to 10.0%, while EMEA-based investors, with the highest allocation, forecast a slight reduction to 11.3%.
Compound Annual Growth Rate
7.9%
Value in USD Billion
2026-2035
*this image is indicative*
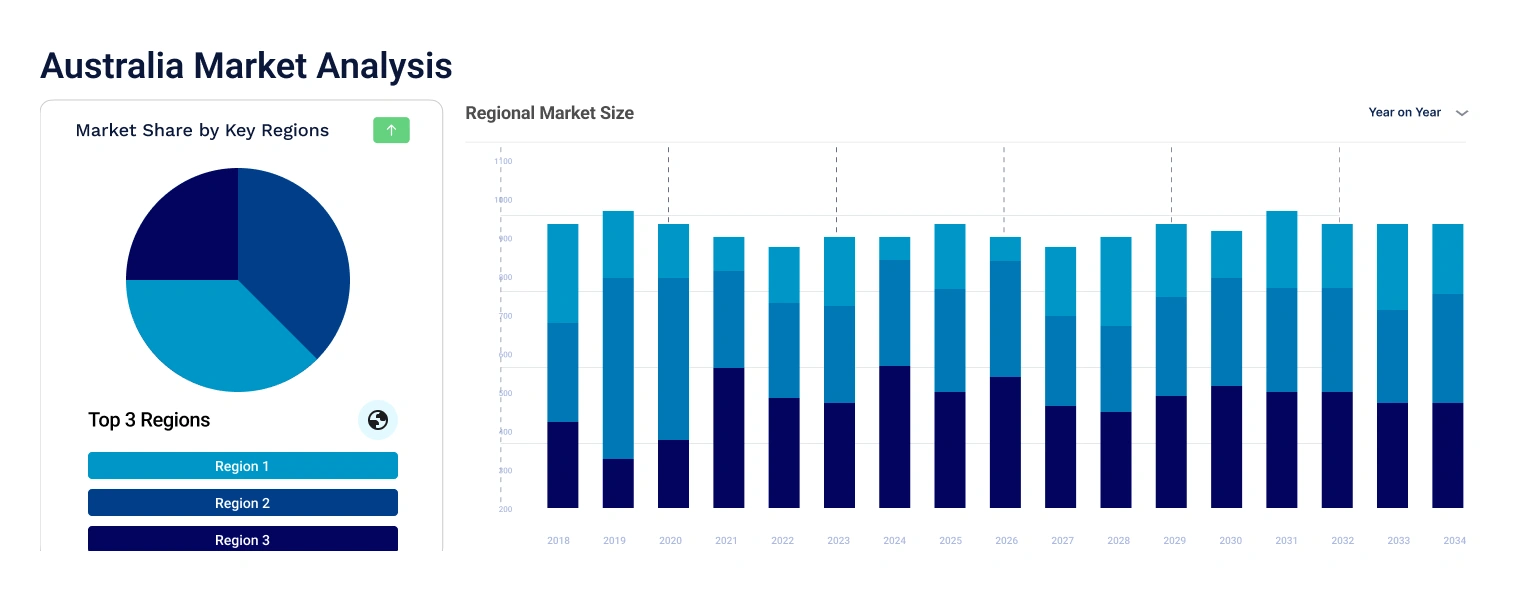
In 2020, the Australia commercial real estate market underwent significant change due to the COVID-19 pandemic, with flexible work arrangements and increased e-commerce altering market dynamics. Despite disruptions, opportunities emerged for investors, landlords, and occupiers. In 2022, commercial real estate entered a new era in Australia, with low-interest rates, government stimulus, and a rebounding population driving market optimism. Investors benefitted from favourable conditions, including cheap debt and structural shifts, while urbanisation and population growth remained key market drivers.
The sector witnessed notable trends such as improved accessibility, shared office spaces, and digital connectivity. However, challenges loomed, particularly with climate concerns prompting the need for innovation to sustain growth. Even before the pandemic, a decline in commercial building activity was anticipated, yet prime office spaces in Melbourne and Sydney maintained high demand and limited vacancy rates.
The rise of flexible workspaces gained traction, offering companies temporary leasing options amid uncertain market conditions. Despite fluctuations, office real estate investment remained steady, partly due to the pandemic’s impact. Meanwhile, industrial and logistics sales surged, led by ESR’s record-breaking acquisition of the Milestone logistics portfolio.
Retail investment activity rebounded despite ongoing challenges faced by malls, driven by a resurgence in retail transactions. Foreign investment in the commercial real estate market in Australia varied, with the USA and Germany showing confidence in the market, while others reduced their commitments.
Regional transaction activities varied, with New South Wales dominating commercial real estate transactions, while Western Australia witnessed a smaller share. A rebound in overseas migration and tourism supported Australia's services sector, prompting a GDP growth forecast upgrade by the IMF.
Institutional investors anticipate steady real estate allocations globally, with Asia Pacific-based investors expected to increase their target allocation. Despite challenges, the Australian property market remains resilient, poised for further growth amidst evolving market dynamics and investor confidence.
Australia Commercial Real Estate Market Report and Forecast 2026-2035 offers a detailed analysis of the market based on the following segments:
Market Breakup by Type
Market Breakup by Region
Key players in the commercial real estate in Australia develop and provide properties and services to support the end-users.


Upto 15% Off
USD
$2499 $2249
$3999 $3599
$4999 $4249
$5999 $5099


*While we strive to always give you current and accurate information, the numbers depicted on the website are indicative and may differ from the actual numbers in the main report. At Expert Market Research, we aim to bring you the latest insights and trends in the market. Using our analyses and forecasts, stakeholders can understand the market dynamics, navigate challenges, and capitalize on opportunities to make data-driven strategic decisions.*
Get in touch with us for a customized solution tailored to your unique requirements and save upto 35%!
The market is estimated to be valued at USD 36.56 Billion in 2025.
The market is projected to grow at a CAGR of 7.90% between 2026 and 2035.
The commercial real estate market is expected to reach USD 78.20 Billion in 2035.
The market is categorised according to its type, which includes industrial and logistics, offices, multi-family, hospitality, and retail.
The key market players are Meriton Group, Frasers Property Australia Pty Limited, Stockland Corporation Limited, Mirvac Limited, ABN Group, Knight Frank Australia Pty Ltd., Colliers International, Gorman Allard Shelton Pty Ltd., and others.
The market is driven by factors that include rise of flexible workspaces, increasing FDI in the market, rapid transformation in the IT and real estate sector, among others.
Commercial property has historically delivered robust returns through a mix of capital appreciation and steady income. Notably, commercial real estate offers a stable income stream, with returns often outperforming those of stocks and displaying lower volatility. This stability underscores the attractiveness of commercial property as an investment option.
In 2025, the top-performing suburbs for both houses and units were exclusively located in Western Australia, South Australia, and Queensland, highlighting the ongoing resilience and vitality of property markets in these states.
Residential vehicle parks and storage facilities present lucrative investment opportunities, delivering high returns without the extensive infrastructure and upkeep demands associated with larger apartment complexes. Additionally, certain segments of the retail and industrial real estate sectors hold the potential for substantial returns.
Explore our key highlights of the report and gain a concise overview of key findings, trends, and actionable insights that will empower your strategic decisions.
| REPORT FEATURES | DETAILS |
| Base Year | 2025 |
| Historical Period | 2019-2025 |
| Forecast Period | 2026-2035 |
| Scope of the Report |
Historical and Forecast Trends, Industry Drivers and Constraints, Historical and Forecast Market Analysis by Segment:
|
| Breakup by Type |
|
| Breakup by Region |
|
| Market Dynamics |
|
| Competitive Landscape |
|
| Companies Covered |
|
Datasheet
One User
USD 2,499
USD 2,249
tax inclusive*
Single User License
One User
USD 3,999
USD 3,599
tax inclusive*
Five User License
Five User
USD 4,999
USD 4,249
tax inclusive*
Corporate License
Unlimited Users
USD 5,999
USD 5,099
tax inclusive*
*Please note that the prices mentioned below are starting prices for each bundle type. Kindly contact our team for further details.*
Flash Bundle
Small Business Bundle
Growth Bundle
Enterprise Bundle
*Please note that the prices mentioned below are starting prices for each bundle type. Kindly contact our team for further details.*
Flash Bundle
Number of Reports: 3
20%
tax inclusive*
Small Business Bundle
Number of Reports: 5
25%
tax inclusive*
Growth Bundle
Number of Reports: 8
30%
tax inclusive*
Enterprise Bundle
Number of Reports: 10
35%
tax inclusive*
How To Order

Select License Type
Choose the right license for your needs and access rights.

Click on ‘Buy Now’
Add the report to your cart with one click and proceed to register.

Select Mode of Payment
Choose a payment option for a secure checkout. You will be redirected accordingly.
Gain insights to stay ahead and seize opportunities.

Get insights & trends for a competitive edge.

Track prices with detailed trend reports.

Analyse trade data for supply chain insights.

Leverage cost reports for smart savings

Enhance supply chain with partnerships.

Connect For More Information
Our expert team of analysts will offer full support and resolve any queries regarding the report, before and after the purchase.
Our expert team of analysts will offer full support and resolve any queries regarding the report, before and after the purchase.
We employ meticulous research methods, blending advanced analytics and expert insights to deliver accurate, actionable industry intelligence, staying ahead of competitors.
Our skilled analysts offer unparalleled competitive advantage with detailed insights on current and emerging markets, ensuring your strategic edge.
We offer an in-depth yet simplified presentation of industry insights and analysis to meet your specific requirements effectively.


Share