

Consumer Insights
Uncover trends and behaviors shaping consumer choices today
Procurement Insights
Optimize your sourcing strategy with key market data
Industry Stats
Stay ahead with the latest trends and market analysis.

The Australia cloud TV market value is expected to grow at a CAGR of 17.60% between 2026 and 2035.
Base Year
Historical Period
Forecast Period
Compound Annual Growth Rate
17.6%
2026-2035
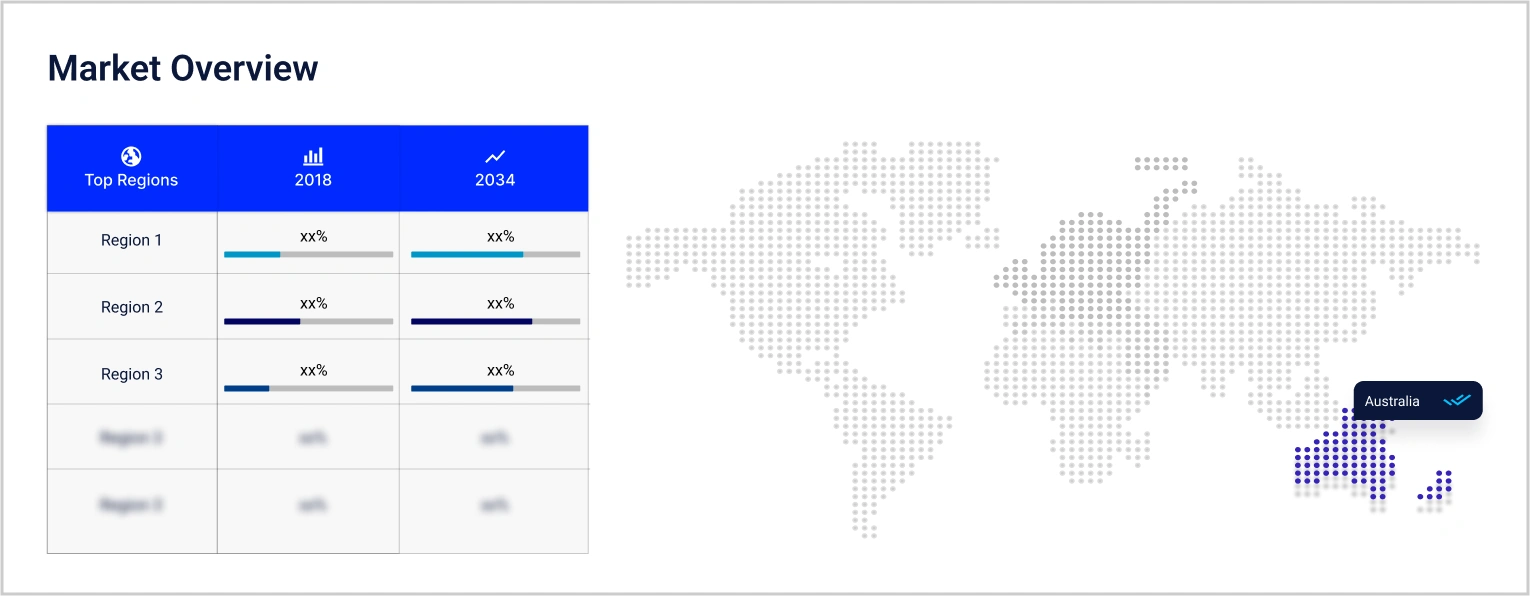
*this image is indicative*
| Australia Cloud TV Market Report Summary | Description | Value |
| Base Year | USD Billion | 2025 |
| Historical Period | USD Billion | 2019-2025 |
| Forecast Period | USD Billion | 2026-2035 |
| Market Size 2025 | USD Billion | XX |
| Market Size 2035 | USD Billion | XX |
| CAGR 2019-2025 | Percentage | XX% |
| CAGR 2026-2035 | Percentage | 17.60% |
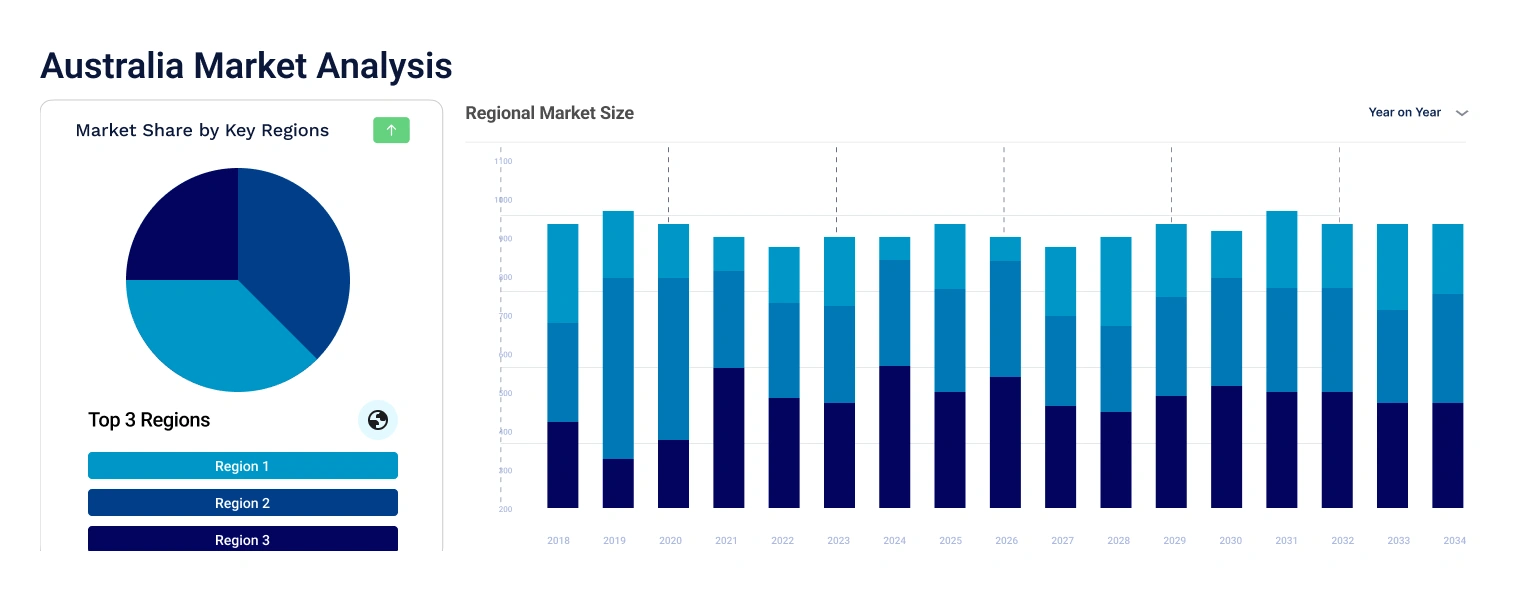
| CAGR 2026-2035 - Market by Region | New South Wales | 18.5% |
| CAGR 2026-2035 - Market by Region | Victoria | 18.1% |
| CAGR 2026-2035 - Market by Device Type | Connected TV | 19.9% |
| CAGR 2026-2035 - Market by Deployment Type | Hybrid Cloud | 19.7% |
Cloud TV, a cloud-based application streaming TV channels, movies, and music, offers a convenient entertainment experience on various electronic devices without requiring substantial memory. Users can access their saved recordings from anywhere and download content for offline viewing.
The Australia cloud TV market trends and dynamics are driven by innovations that enhance user experience and provide real-time updates for better functionality. The platform offers personalised viewing across devices, fuelling market expansion to cater to varied audience preferences.
Cloud TV adoption among SMEs is propelled by its minimal infrastructure requirements, leading to significant time and cost savings. Leveraging cloud computing platforms like Google Cloud and Microsoft Azure, integrated solutions streamline content delivery and enable personalised viewing experiences, catering to varied audience segments.
The public cloud segment dominates the growth of the Australia cloud TV market, driven by the adoption of serverless computing models and hybrid strategies, ensuring flexibility and resilience in content delivery. As cloud TV continues to evolve, its scalability and flexibility promise growth in viewership and content consumption, making it an attractive option for SMEs seeking to expand their reach in the digital era.
As per the Australian Bureau of Statistics, household goods retailing increased by 1.1% (USD 41.05 million), reaching USD 3783.80 million in May 2024, up from USD 3742.75 million in April 2024. In this category, the retail of electrical and electronic goods increased by 0.8% (USD 10.23 million), contributing to the growth of the Australia cloud TV industry revenue as cloud TV is becoming a key component in household goods retail, offering features like seamless streaming, personalised recommendations, and smart home integration.
As the Australian Bureau of Statistics reported, in the first quarter of 2024, household spending on furnishings and household equipment highlighted significant growth, with a notable increase of 3.3% in May. Therefore, Tasmania led with a 10.0% rise, followed by South Australia (4.6%), Victoria (4.3%), Western Australia (4.4%), and Queensland (3.8%). New South Wales also experienced an increase of 2.1%. This growth determines a robust demand for furnishings and household equipment across multiple regions.
According to the Australian Bureau of Statistics, the value added by digital activity in Australia was estimated to be approximately USD 79.97 billion in 2019-20 which significantly increased to USD 102.60 billion by 2021-22. In Australia, the share of digital media in the total digital activity value added is estimated to be approximately 4.3% in 2021-22 as per the Australian Bureau of Statistics.
According to the Australian Bureau of Statistics, between 2020-21 and 2021-22, gross disposable income per household increased by 3.7% to USD 104,478.78. Additionally, final consumption expenditure (FCE) per household rose by 5.9% to USD 78,521.37 during the same period. According to the Australian Bureau of Statistics, e-commerce's share of Australia's total digital activity value added has grown steadily over three years, from about 5.2% in 2019-20 to 7.1% in 2021-22. This is further indicating the growing Australia cloud TV market revenue as the penetration of streaming services increases.
“Australia Cloud TV Market Report and Forecast 2026-2035” offers a detailed analysis of the market based on the following segments:
Market Breakup by Device Type
Market Breakup by Deployment Type
Market Breakup by Application
Market Breakup by Region
| CAGR 2026-2035 - Market by | Region |
| New South Wales | 18.5% |
| Victoria | 18.1% |
| Queensland | XX% |
| Australian Capital Territory | XX% |
| Western Australia | XX% |
| Others | XX% |
Telecom companies play a crucial role in the cloud TV market by delivering high-speed internet, which facilitates smooth streaming and minimizes buffering. They often bundle Cloud TV with internet and phone services, providing attractive, cost-effective packages. Investments in 5G and fibre networks further enhance Cloud TV performance, driving growth of the Australia cloud TV industry.
Media companies are key to Cloud TV’s success by offering a wide variety of content that appeals to diverse audiences, boosting user engagement. Exclusive partnerships with Cloud TV providers introduce unique content and features, attracting more subscribers. Additionally, entertainment firms leverage Cloud TV’s advanced technology to offer immersive and interactive experiences, enhancing consumer appeal.
IT advancements are essential for the cloud TV infrastructure, ensuring it operates reliably and scales effectively. Data analytics help Cloud TV providers tailor content to user preferences, while robust security measures protect user data and content, addressing privacy concerns and fostering consumer trust. These factors contribute to the growing demand of the Australia cloud TV market.
The companies specialise in cloud-based solutions and services, offering a range of products from cloud storage to advanced computing solutions.


Upto 15% Off
USD
$2499 $2249
$3999 $3599
$4999 $4249
$5999 $5099


*While we strive to always give you current and accurate information, the numbers depicted on the website are indicative and may differ from the actual numbers in the main report. At Expert Market Research, we aim to bring you the latest insights and trends in the market. Using our analyses and forecasts, stakeholders can understand the market dynamics, navigate challenges, and capitalize on opportunities to make data-driven strategic decisions.*
Get in touch with us for a customized solution tailored to your unique requirements and save upto 35%!
The Australia cloud TV market value is projected to grow at a CAGR of 17.60% between 2026 and 2035.
The major applications include telecom, entertainment and media, information technology, consumer television, and others.
The competitive landscape consists of EllasTVMax, Cloud365 Australia Pty Limited, CommScope, Inc., LG Electronics Australia Pty Ltd., and Sharp EIT Solutions among others.
The market is driven by factors that include increasing demand from SMEs, rising adoption of IoT connected devices, growing cloud computing application platforms, among others.
The market is categorised according to its deployment type, which includes public cloud, private cloud, and hybrid cloud.
The leading cloud service providers are Amazon Web Services (AWS), Microsoft Azure, and Google Cloud Platform (GCP).
Cloud computing is credited to J. C. R. Licklider, who pioneered its development in the 1960s through his work on ARPANET, aiming to facilitate remote access to data and individuals regardless of location or time.
In 2006, Amazon introduced the inaugural commercial cloud service, known as the Elastic Computer Cloud (EC2).
The market is broken down into New South Wales, Victoria, Queensland, Western Australia, Australian Capital Territory and others.
Explore our key highlights of the report and gain a concise overview of key findings, trends, and actionable insights that will empower your strategic decisions.
| REPORT FEATURES | DETAILS |
| Base Year | 2025 |
| Historical Period | 2019-2025 |
| Forecast Period | 2026-2035 |
| Scope of the Report |
Historical and Forecast Trends, Industry Drivers and Constraints, Historical and Forecast Market Analysis by Segment:
|
| Breakup by Device Type |
|
| Breakup by Deployment Type |
|
| Breakup by Application |
|
| Breakup by Region |
|
| Market Dynamics |
|
| Competitive Landscape |
|
| Companies Covered |
|
Datasheet
One User
USD 2,499
USD 2,249
tax inclusive*
Single User License
One User
USD 3,999
USD 3,599
tax inclusive*
Five User License
Five User
USD 4,999
USD 4,249
tax inclusive*
Corporate License
Unlimited Users
USD 5,999
USD 5,099
tax inclusive*
*Please note that the prices mentioned below are starting prices for each bundle type. Kindly contact our team for further details.*
Flash Bundle
Small Business Bundle
Growth Bundle
Enterprise Bundle
*Please note that the prices mentioned below are starting prices for each bundle type. Kindly contact our team for further details.*
Flash Bundle
Number of Reports: 3
20%
tax inclusive*
Small Business Bundle
Number of Reports: 5
25%
tax inclusive*
Growth Bundle
Number of Reports: 8
30%
tax inclusive*
Enterprise Bundle
Number of Reports: 10
35%
tax inclusive*
How To Order

Select License Type
Choose the right license for your needs and access rights.

Click on ‘Buy Now’
Add the report to your cart with one click and proceed to register.

Select Mode of Payment
Choose a payment option for a secure checkout. You will be redirected accordingly.
Gain insights to stay ahead and seize opportunities.

Get insights & trends for a competitive edge.

Track prices with detailed trend reports.

Analyse trade data for supply chain insights.

Leverage cost reports for smart savings

Enhance supply chain with partnerships.

Connect For More Information
Our expert team of analysts will offer full support and resolve any queries regarding the report, before and after the purchase.
Our expert team of analysts will offer full support and resolve any queries regarding the report, before and after the purchase.
We employ meticulous research methods, blending advanced analytics and expert insights to deliver accurate, actionable industry intelligence, staying ahead of competitors.
Our skilled analysts offer unparalleled competitive advantage with detailed insights on current and emerging markets, ensuring your strategic edge.
We offer an in-depth yet simplified presentation of industry insights and analysis to meet your specific requirements effectively.


Share