

Consumer Insights
Uncover trends and behaviors shaping consumer choices today
Procurement Insights
Optimize your sourcing strategy with key market data
Industry Stats
Stay ahead with the latest trends and market analysis.

The Australia aluminium market reached around USD 7.23 Billion in 2025. The market is projected to grow at a CAGR of 4.70% between 2026 and 2035, reaching almost USD 11.44 Billion by 2035.
Base Year
Historical Period
Forecast Period
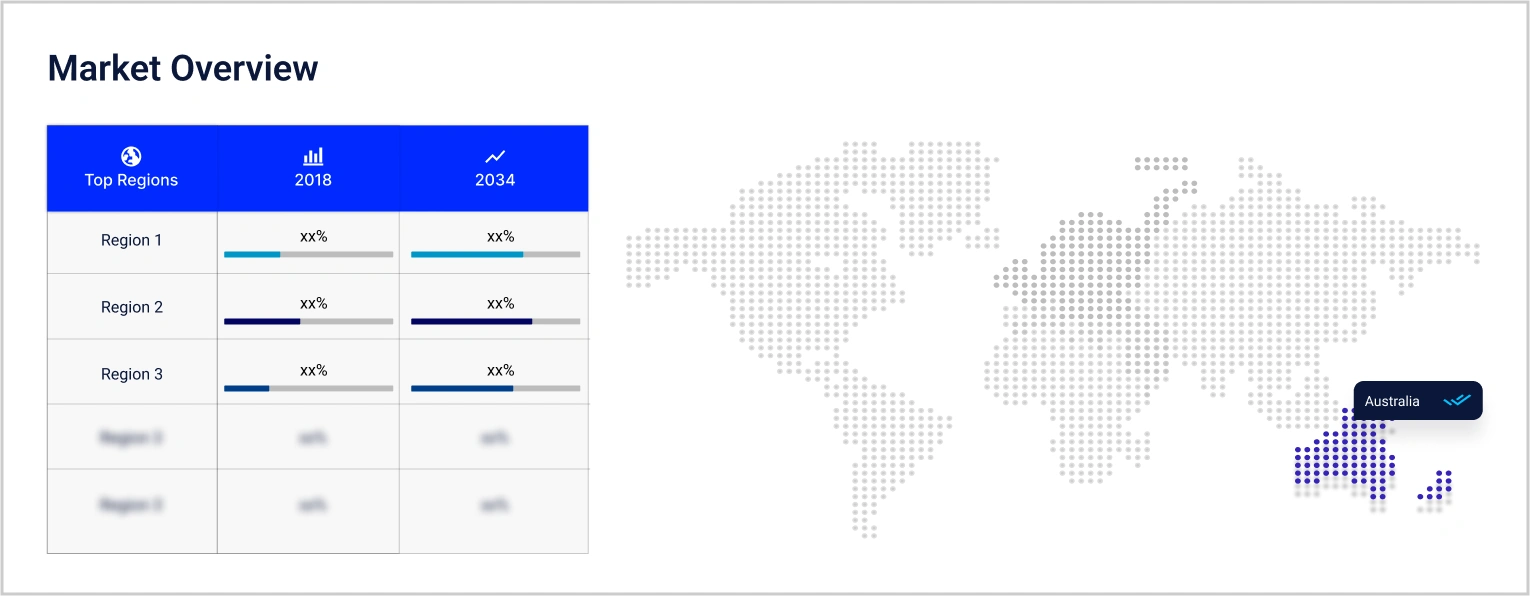
Australia is one of the leading countries specialising in aluminium refining.
In 2022, Australia produced 22.3MT of alumina, making it the second-largest producer in the world.
In 2022, Australia produced 1.51MT of primary aluminium, which made it the sixth largest producer worldwide
Compound Annual Growth Rate
4.7%
Value in USD Billion
2026-2035
*this image is indicative*
| Australia Aluminium Market Report Summary | Description | Value |
| Base Year | USD Billion | 2025 |
| Historical Period | USD Billion | 2019-2025 |
| Forecast Period | USD Billion | 2026-2035 |
| Market Size 2025 | USD Billion | 7.23 |
| Market Size 2035 | USD Billion | 11.44 |
| CAGR 2019-2025 | Percentage | XX% |
| CAGR 2026-2035 | Percentage | 4.70% |
| CAGR 2026-2035 - Market by Region | New South Wales | 5.0% |
| CAGR 2026-2035 - Market by Region | Western Australia | 4.5% |
| CAGR 2026-2035 - Market by Type | Primary | 5.4% |
| CAGR 2026-2035 - Market by End Use | Transport | 5.4% |
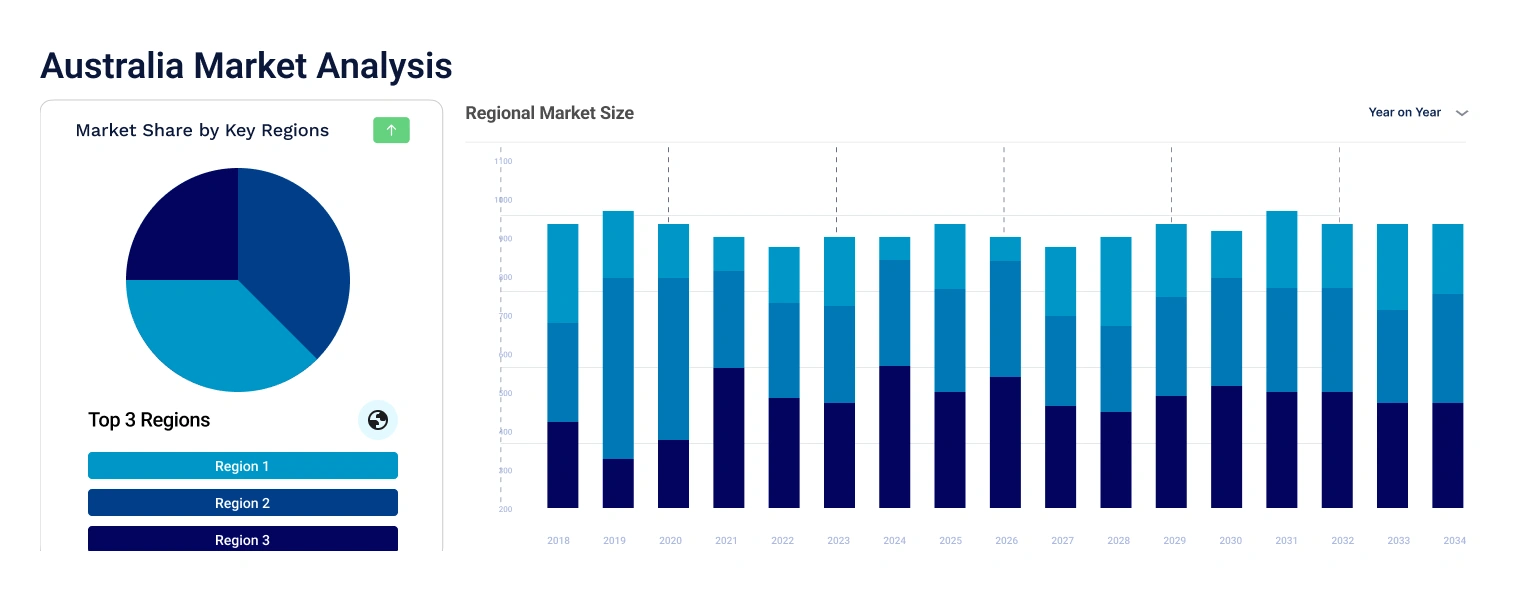
| Market Share by Region | New South Wales | 30.6% |
In December 2023, along the lines of other countries located in North America and Europe, Australia recognised aluminium as a strategic material, which is imperative for driving a clean energy transition. This is because aluminium powers numerous low-carbon technologies like hydroelectric plants, wind turbines, transmission wires, and batteries, among others. It also constitutes 85% of the total components of solar panels. As rooftop solar energy outpaces wind energy in Australia for electricity generation, the demand for aluminium is expected to register a significant growth in the coming years.
Globally, aluminium production accounts for nearly 3% of the total industrial carbon emissions. Though the average intensity of emissions has been declining by 2% annually, it needs to further fall to 4% annually. Major aluminium producers and recycling firms in Australia have signed contracts with wind energy-based electricity-generating companies to power up their processes. For instance, in February 2024, Rio Tinto signed a power purchase agreement with Windlab to supply clean electricity to refineries and smelting plants located in Gladstone, Queensland. This can reduce 5 million tons of carbon emissions annually and generate enough power to meet 10% of Queensland’s energy needs.
Australia Aluminium Market Report and Forecast 2026-2035 offers a detailed analysis of the market based on the following segments:
Market Breakup by Type
Market Breakup by Processing Method
Market Breakup by End Use
Market Breakup by Region
| CAGR 2026-2035 - Market by | Type |
| Primary | 5.4% |
| Secondary | XX% |
| CAGR 2026-2035 - Market by | End Use |
| Transport | 5.4% |
| Others | 4.2% |
| Construction | XX% |
| Electrical | XX% |
| Machinery and Equipment | XX% |
| CAGR 2026-2035 - Market by | Region |
| New South Wales | 5.0% |
| Western Australia | 4.5% |
| Victoria | XX% |
| Queensland | XX% |
| Australian Capital Territory | XX% |
| Others | XX% |
Based on end use, the market is divided into transport, construction, electrical, and machine and machinery, among others. Over the forecast period, the transport sector is projected to grow at a CAGR of 5.4% during the forecast period of 2026-2035. This can be attributed to the low strength-to-weight ratio of aluminium, which makes it ideal for use in automobiles and other mobility solutions.
| Market Share by | Region |
| New South Wales | 30.6% |
| Victoria | XX% |
| Queensland | XX% |
| Australian Capital Territory | XX% |
| Western Australia | XX% |
Key players are investing to expand their production capacity amid the rising demand for aluminium in renewable energy sources.


Upto 15% Off
USD
$2499 $2249
$3999 $3599
$4999 $4249
$5999 $5099


*While we strive to always give you current and accurate information, the numbers depicted on the website are indicative and may differ from the actual numbers in the main report. At Expert Market Research, we aim to bring you the latest insights and trends in the market. Using our analyses and forecasts, stakeholders can understand the market dynamics, navigate challenges, and capitalize on opportunities to make data-driven strategic decisions.*
Get in touch with us for a customized solution tailored to your unique requirements and save upto 35%!
The market was valued at nearly USD 7.23 Billion in 2025.
The market is projected to grow at a CAGR of 4.70% between 2026 and 2035.
The market is assessed to witness a healthy growth in the forecast period to reach around USD 11.44 Billion in 2035.
The different end uses of aluminium include transport, construction, electrical, and machinery and equipment, among others.
The different processing methods of aluminium include flat rolled, extrusions, castings, forgings, pigments and powder, rod and bar, and sheet, among others.
The different regions covered in the market report include New South Wales, Victoria, Queensland, Australian Capital Territory, and Western Australia, among others.
The key market players are Aluminium Industries of Australia Pty Ltd., Tomago Aluminium, Rio Tinto plc (Queensland Alumina Limited), Gra Steel Company, and Rogers Industries Group, among others.
Explore our key highlights of the report and gain a concise overview of key findings, trends, and actionable insights that will empower your strategic decisions.
| REPORT FEATURES | DETAILS |
| Base Year | 2025 |
| Historical Period | 2019-2025 |
| Forecast Period | 2026-2035 |
| Scope of the Report |
Historical and Forecast Trends, Industry Drivers and Constraints, Historical and Forecast Market Analysis by Segment:
|
| Breakup by Type |
|
| Breakup by Processing Method |
|
| Breakup by End Use |
|
| Breakup by Region |
|
| Market Dynamics |
|
| Competitive Landscape |
|
| Companies Covered |
|
Datasheet
One User
USD 2,499
USD 2,249
tax inclusive*
Single User License
One User
USD 3,999
USD 3,599
tax inclusive*
Five User License
Five User
USD 4,999
USD 4,249
tax inclusive*
Corporate License
Unlimited Users
USD 5,999
USD 5,099
tax inclusive*
*Please note that the prices mentioned below are starting prices for each bundle type. Kindly contact our team for further details.*
Flash Bundle
Small Business Bundle
Growth Bundle
Enterprise Bundle
*Please note that the prices mentioned below are starting prices for each bundle type. Kindly contact our team for further details.*
Flash Bundle
Number of Reports: 3
20%
tax inclusive*
Small Business Bundle
Number of Reports: 5
25%
tax inclusive*
Growth Bundle
Number of Reports: 8
30%
tax inclusive*
Enterprise Bundle
Number of Reports: 10
35%
tax inclusive*
How To Order

Select License Type
Choose the right license for your needs and access rights.

Click on ‘Buy Now’
Add the report to your cart with one click and proceed to register.

Select Mode of Payment
Choose a payment option for a secure checkout. You will be redirected accordingly.
Gain insights to stay ahead and seize opportunities.

Get insights & trends for a competitive edge.

Track prices with detailed trend reports.

Analyse trade data for supply chain insights.

Leverage cost reports for smart savings

Enhance supply chain with partnerships.

Connect For More Information
Our expert team of analysts will offer full support and resolve any queries regarding the report, before and after the purchase.
Our expert team of analysts will offer full support and resolve any queries regarding the report, before and after the purchase.
We employ meticulous research methods, blending advanced analytics and expert insights to deliver accurate, actionable industry intelligence, staying ahead of competitors.
Our skilled analysts offer unparalleled competitive advantage with detailed insights on current and emerging markets, ensuring your strategic edge.
We offer an in-depth yet simplified presentation of industry insights and analysis to meet your specific requirements effectively.


Share