

Consumer Insights
Uncover trends and behaviors shaping consumer choices today
Procurement Insights
Optimize your sourcing strategy with key market data
Industry Stats
Stay ahead with the latest trends and market analysis.

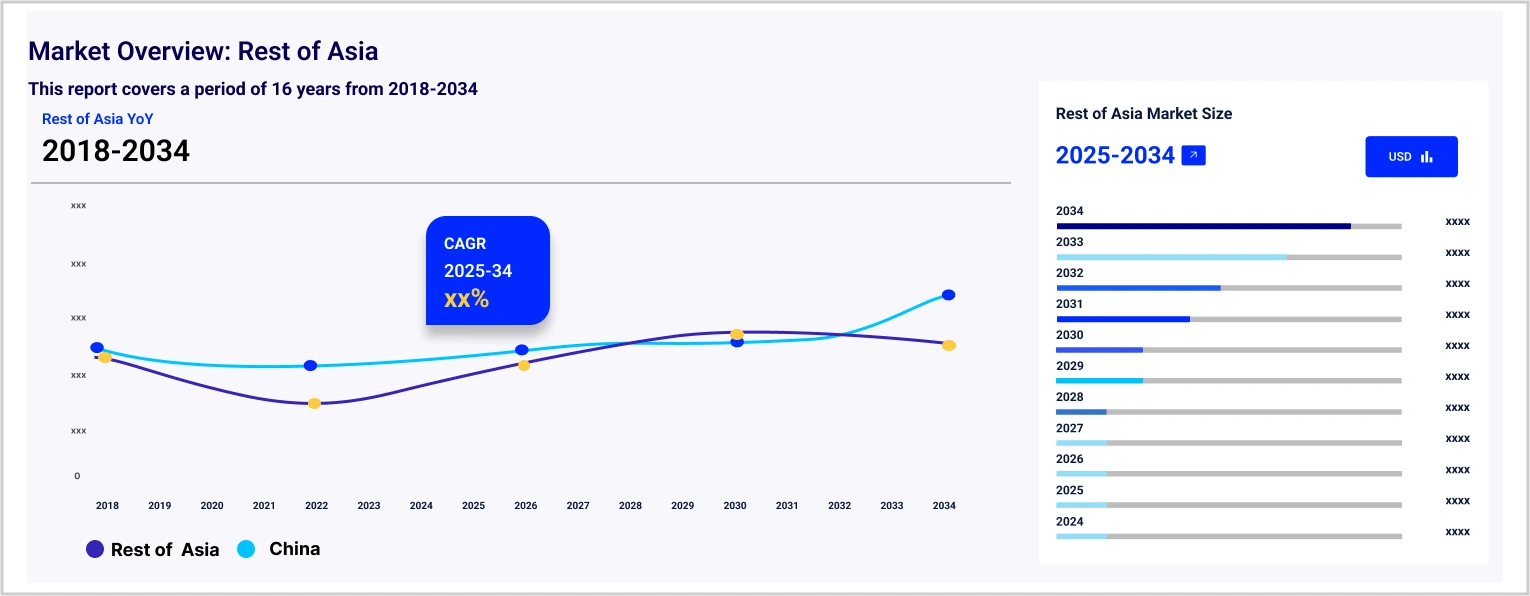
The Asia Thai cuisine market size is projected to grow at a CAGR of 9.30% between 2026 and 2035. Increasing popularity of Thai food across regions is a key market driver.
Base Year
Historical Period
Forecast Period
TasteAtlas.com ranks Thai cuisine at the 17th position in its list of “100 Best Cuisine in the World”.
Michelin starred restaurants serving five-course southern Thai foods have a menu costing over USD 100.
In 2021, Thai food exports to China recorded a y-o-y growth of 40%, impacting Asia Thai cuisine market revenue.
Compound Annual Growth Rate
9.3%
2026-2035
*this image is indicative*
| Asia Thai Cuisine Market Report Summary | Description | Value |
| Base Year | USD Million | 2025 |
| Historical Period | USD Million | 2019-2025 |
| Forecast Period | USD Million | 2026-2035 |
| Market Size 2025 | USD Million | XX |
| Market Size 2035 | USD Million | XX |
| CAGR 2019-2025 | Percentage | XX% |
| CAGR 2026-2035 | Percentage | 9.30% |
| CAGR 2026-2035 - Market by Region | East Asia | 10.2% |
| CAGR 2026-2035 - Market by Region | South Asia | 8.9% |
| CAGR 2026-2035 - Market by Product Type | Ready To Cook | 10.4% |
| CAGR 2026-2035 - Market by Distribution Channel | Online | 10.2% |
| Market Share by Region | South Asia | 14.4% |
In 2021, food production recorded a year-on-year growth of 2.9% in Thailand. The increasing demand for Thai food from countries such as China led to 4.5% year-on-year growth in exports, reaching USD 18.6 billion.
In a report released in December 2023, TasteAtlas.com ranked Phat Kaphrao as the world’s third most popular cuisine. It was earlier called the “Best Stir-Fries in the World 2023” due to its unique taste. It is prepared from meat, basil, and chilli, and enjoys great appeal among tourists and natives alike. As per Asia Thai cuisine market analysis, other Asian cuisines from South Korea (4.46), Vietnam (4.44), Iran (4.42), and Lebanon (4.40) followed closely.
Southern Thai food have recently become exceedingly popular among people. Restaurants providing a relatively refined version of cuisines belonging to southern Thailand have witnessed long queues of reservations weeks in advance, where people prefer to enjoy family dinners and dates. Southern Thai food is prepared from unique local ingredients that impart a variety of flavours and aromas to the dishes. Though this cuisine is renowned for its heat, sweet and savoury dishes prepared from palm sugar are also consumed on a large scale.
Strengthening regulations of food labelling; rising government support for bolstering food manufacturing; increasing exports of agricultural products; and growth of nutraceuticals industry are factors impacting the Asia Thai cuisine market growth
This is expected to enhance consumer awareness regarding food ingredients and avoid the consumption of allergens.
Increasing investments in food-tech startups revolutionising product packaging and food safety is expected to drive Asia Thai cuisine market expansion.
This can be attributed to the expansion of total area under cultivation, as well as deployment of new technologies.
In 2019, Thailand reported USD 3.5 billion worth of sales of nutraceuticals products across the country.
The presence of undeclared food allergens in 7.22% of the local food system raised significant concerns surrounding consumer health in Thailand. Hence, the Thai Food and Drug Association proposed that food manufacturers should have clear and concise information regarding food allergens on product labels. Such food allergens may include gluten, crustaceans, seafood such as squids and fish, soy and milk products, and peanuts, among others. It also proposed that manufacturers should adopt a uniform code of labelling expiration date on food products, including a specific date, month, and year format. This is expected to promote the consumption of Thai cuisines, thereby driving market growth.
The Expert Market Research report titled “Asia Thai Cuisine Market Report and Forecast 2026-2035” offers a detailed analysis of the market based on the following segments:
Market Breakup by Product Type
Market Breakup by Application
Market Breakup by Distribution Channel
Market Breakup by Region
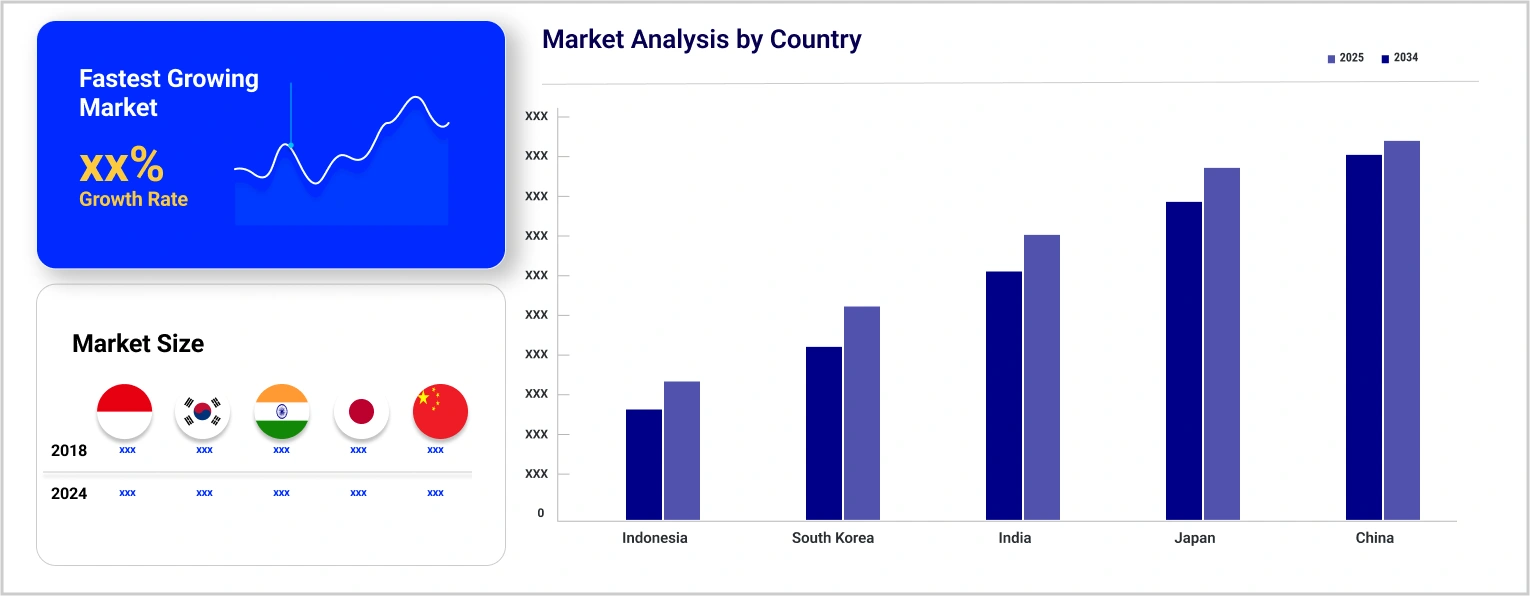
Based on region, the market is segmented into Southeast Asia, East Asia, South Asia, and Central Asia. South Asia is projected to dominate the market, representing 14% of the overall market share. Over the forecast period, East Asia is expected to grow at a CAGR of 10.2% as the demand for Thai cuisines is increasing across nations such as Japan.
| CAGR 2026-2035 - Market by | Region |
| East Asia | 10.2% |
| South Asia | 8.9% |
| South East Asia | XX% |
| Central Asia | XX% |
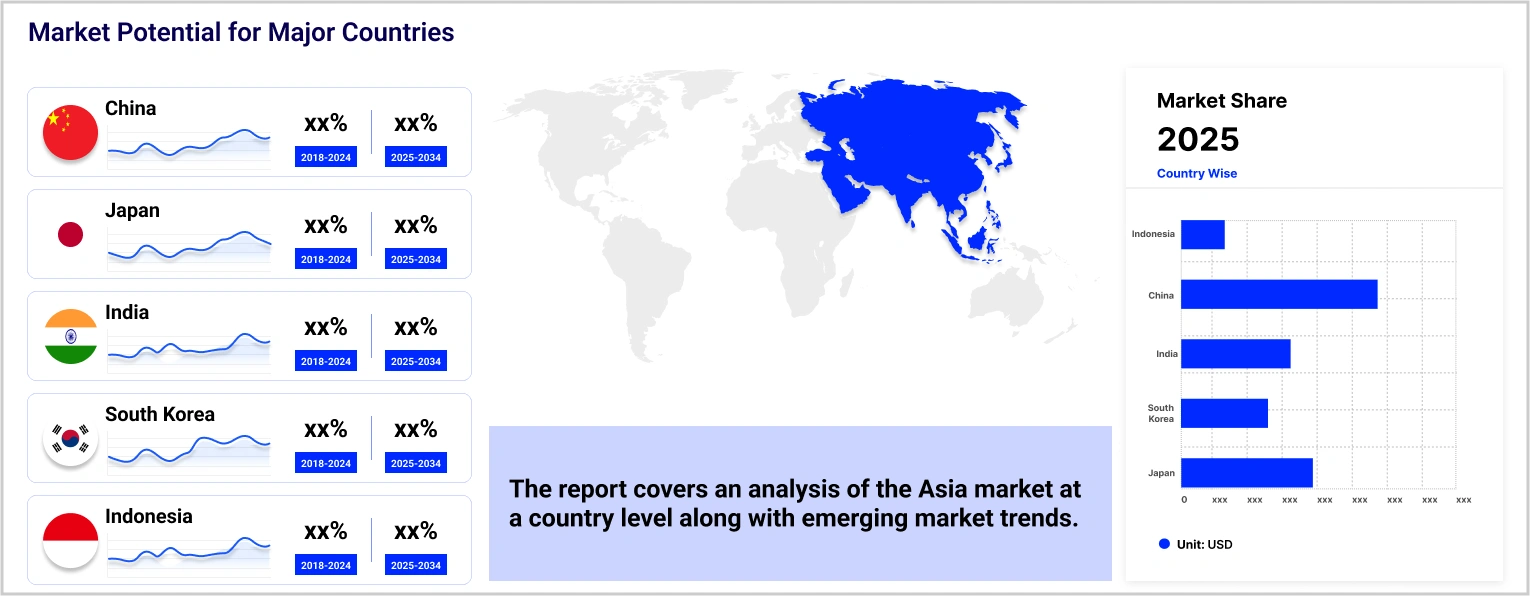
Major players are expanding their digital presence to cater to individual consumer palettes, thereby driving Asia Pacific Thai cuisine market share. Moreover, major markets such as India are expected to become mainstream revenue sources for the industry over the forecast period.
Monty & Totco Co., Ltd. is a prominent player in the Thai food industry, headquartered in Thailand and founded in 1990. The company specialises in the production and distribution of various food products, particularly sauces and condiments.
Founded in 1969 and based in Singapore, Thai Sing Foodstuffs Industry Pte Ltd offers a variety of sauces, pastes, and condiments, including Hainanese chicken rice paste and sambal chilli. The company also holds ISO 22000 and Halal certifications.
CURRY & SPICES CO., LTD., commonly referred to as Namjai, is another key player in the Asia Pacific Thai cuisine market. Founded in 1995 and based in Thailand, the company offers an array of curry pastes and spice blends that reflect the rich culinary heritage of Thailand.
Premier Foods Inc., known for its Sharwood brand, is headquartered in the United Kingdom and was established in 2004. The company focuses on Asian food products by offering sauces, noodles, and ready meals that cater primarily to the UK market.
*Please note that this is only a partial list; the complete list of key players is available in the full report. Additionally, the list of key players can be customized to better suit your needs.*
Other players included in the Asia Thai cuisine market report are Ab World Foods Asia Ltd. (Blue Dragon), among others.


Upto 15% Off
USD
$3999 $3599
$2499 $2249
$4999 $4249
$5999 $5099


*While we strive to always give you current and accurate information, the numbers depicted on the website are indicative and may differ from the actual numbers in the main report. At Expert Market Research, we aim to bring you the latest insights and trends in the market. Using our analyses and forecasts, stakeholders can understand the market dynamics, navigate challenges, and capitalize on opportunities to make data-driven strategic decisions.*
Get in touch with us for a customized solution tailored to your unique requirements and save upto 35%!
The market is assessed to grow at a CAGR of 9.30% between 2026 and 2035.
The different distribution channels in the market are supermarkets and hypermarkets, online, and specialty stores, among others.
The different types of products in the market are ready to cook, condiments, and cooking ingredients.
The different applications of Indian cuisines in the market are processed food, household, and foodservice.
The different regions covered in the market report are Southeast Asia, East Asia, South Asia, and Central Asia.
Key players in the market are & Totco Co.,Ltd., Thai Sing Foodstuffs Industry Pte Ltd., Premier Foods Inc. (Sharwood), CURRY & SPICES CO.,LTD. (Namjai), and Ab World Foods Asia Ltd. (Blue Dragon), among others.
Explore our key highlights of the report and gain a concise overview of key findings, trends, and actionable insights that will empower your strategic decisions.
| REPORT FEATURES | DETAILS |
| Base Year | 2025 |
| Historical Period | 2019-2025 |
| Forecast Period | 2026-2035 |
| Scope of the Report |
Historical and Forecast Trends, Industry Drivers and Constraints, Historical and Forecast Market Analysis by Segment:
|
| Breakup by Product Type |
|
| Breakup by Application |
|
| Breakup by Distribution Channel |
|
| Breakup by Region |
|
| Market Dynamics |
|
| Competitive Landscape |
|
| Companies Covered |
|
Single User License
One User
USD 3,999
USD 3,599
tax inclusive*
Datasheet
One User
USD 2,499
USD 2,249
tax inclusive*
Five User License
Five User
USD 4,999
USD 4,249
tax inclusive*
Corporate License
Unlimited Users
USD 5,999
USD 5,099
tax inclusive*
*Please note that the prices mentioned below are starting prices for each bundle type. Kindly contact our team for further details.*
Flash Bundle
Small Business Bundle
Growth Bundle
Enterprise Bundle
*Please note that the prices mentioned below are starting prices for each bundle type. Kindly contact our team for further details.*
Flash Bundle
Number of Reports: 3
20%
tax inclusive*
Small Business Bundle
Number of Reports: 5
25%
tax inclusive*
Growth Bundle
Number of Reports: 8
30%
tax inclusive*
Enterprise Bundle
Number of Reports: 10
35%
tax inclusive*
How To Order

Select License Type
Choose the right license for your needs and access rights.

Click on ‘Buy Now’
Add the report to your cart with one click and proceed to register.

Select Mode of Payment
Choose a payment option for a secure checkout. You will be redirected accordingly.
Gain insights to stay ahead and seize opportunities.

Get insights & trends for a competitive edge.

Track prices with detailed trend reports.

Analyse trade data for supply chain insights.

Leverage cost reports for smart savings

Enhance supply chain with partnerships.

Connect For More Information
Our expert team of analysts will offer full support and resolve any queries regarding the report, before and after the purchase.
Our expert team of analysts will offer full support and resolve any queries regarding the report, before and after the purchase.
We employ meticulous research methods, blending advanced analytics and expert insights to deliver accurate, actionable industry intelligence, staying ahead of competitors.
Our skilled analysts offer unparalleled competitive advantage with detailed insights on current and emerging markets, ensuring your strategic edge.
We offer an in-depth yet simplified presentation of industry insights and analysis to meet your specific requirements effectively.


Share