

Consumer Insights
Uncover trends and behaviors shaping consumer choices today
Procurement Insights
Optimize your sourcing strategy with key market data
Industry Stats
Stay ahead with the latest trends and market analysis.
Trending Now


The Asia Pacific used car market size reached around USD 793.30 Billion in 2024. The market is projected to grow at a CAGR of 8.30% between 2025 and 2034 to reach nearly USD 1760.85 Billion by 2034.
Base Year
Historical Period
Forecast Period


Value in USD Billion
2025-2034
Asia Pacific Used Car Market Outlook
*this image is indicative*
| Asia Pacific Used Car Market Report Summary | Description | Value |
| Base Year | USD Billion | 2024 |
| Historical Period | USD Billion | 2018-2024 |
| Forecast Period | USD Billion | 2025-2034 |
| Market Size 2024 | USD Billion | 793.30 |
| Market Size 2034 | USD Billion | 1760.85 |
| CAGR 2018-2024 | Percentage | XX% |
| CAGR 2025-2034 | Percentage | 8.30% |
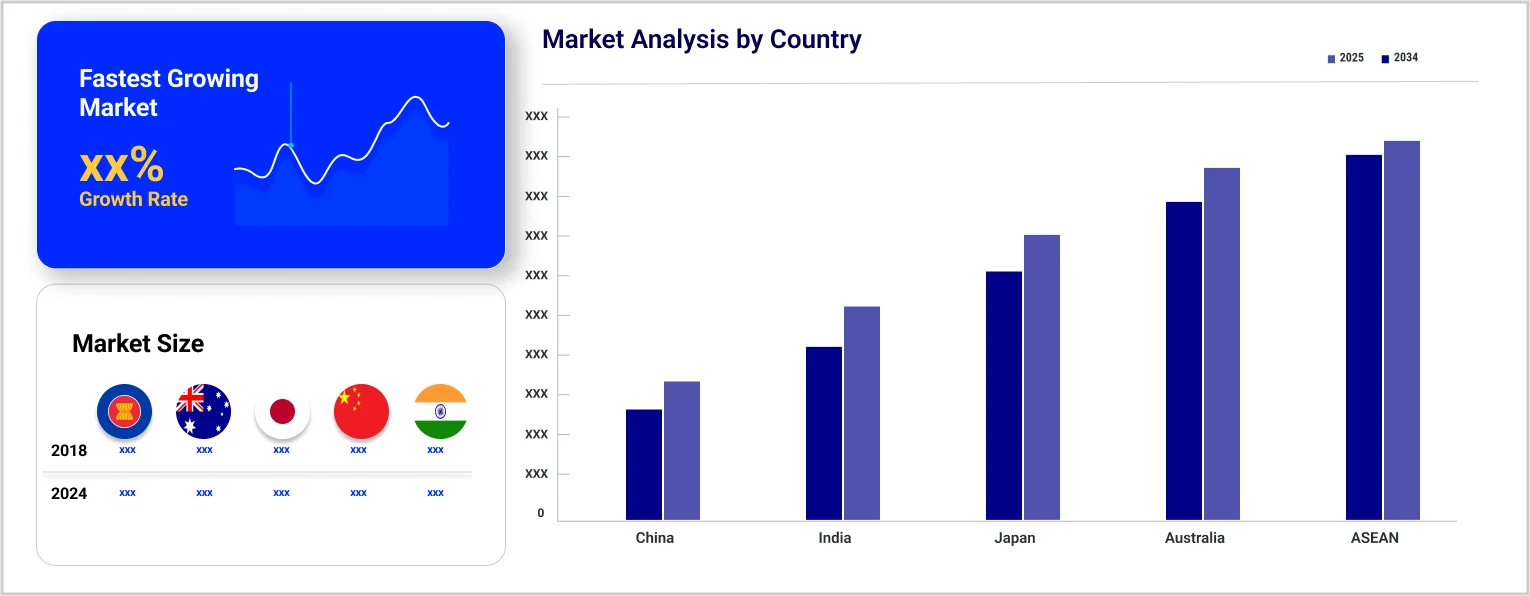
| CAGR 2025-2034 - Market by Country | India | 9.5% |
| CAGR 2025-2034 - Market by Country | China | 8.9% |
| CAGR 2025-2034 - Market by Vehicle Type | Sports Utility Vehicle (SUV) | 9.1% |
| CAGR 2025-2034 - Market by Sales Channel | Online | 11.6% |
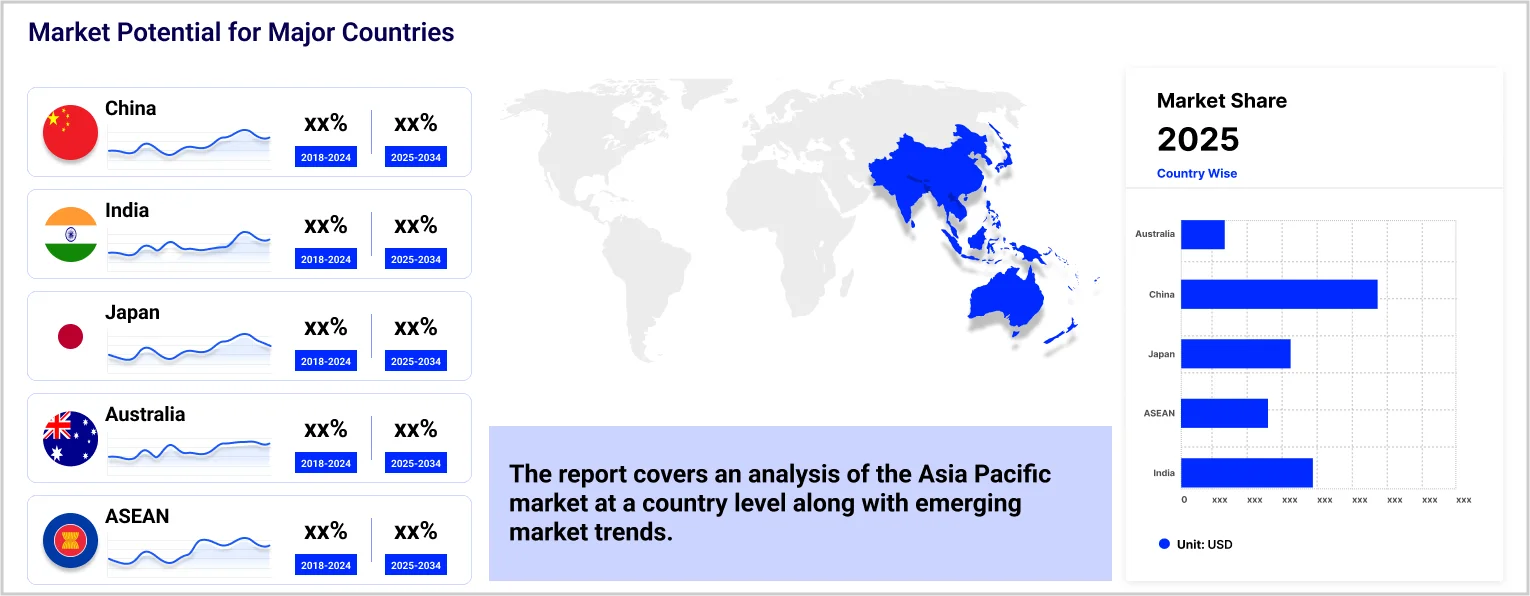
| 2024 Market Share by Country | India | 12.3% |
Second-hand automotive retailers operating in India’s organised sector recorded a year-on-year growth of 30% in 2023. This can be attributed to their growing digital presence, which has enabled consumers to compare vehicles, check prices, and confirm their specifications. As per industry reports, the demand for used vehicles in non-metropolitan regions of India grew from 55% to 65%, indicating rising consumer disposable incomes and improved access to financing options. The average age of a used vehicle in India has also declined from 6 years to 4 years, which is also favourably shaping the Asia Pacific used car market outlook.
Vietnam is also witnessing a surge in demand for second-hand vehicles, due to increasing vehicle ownership costs and high tax rates. With the growth of middle-class population, the demand for cost-effective and fuel-efficient vehicle models has been rising steadily. Nearly 8 out of 10 most popular used car models in Vietnam are Japanese, indicating high consumer preference for durable vehicles which have a high resale value. The increasing demand for safe and high-quality vehicles in Vietnam is also anticipated to fuel growth of the Asia Pacific used car market over the forecast period.
Formalisation of used car dealerships in India; shift towards EVs in China; evolving consumer preferences in Australia; and increasing use of AI are factors favouring the Asia Pacific used car market growth.
By 2050, the organised retail sector is expected to account for 50% of overall pre-owned vehicle purchases in India, due to rationalisation of tax rates, streamlined market access, and shift towards transparent selling and buying processes.
In 2023, nearly 18.41 million used motor vehicles were traded for around USD 162.99 billion. This can be attributed to the favourable legal environment and the government push towards decarbonising the transportation industry.
Major second-hand automotive dealerships are relying on AI tools for automotive inspection to arrive at an accurate estimate of vehicle repair costs and accordingly make an informed purchase decision. This is enhancing the Asia Pacific used car market revenue.
In Australia, Tesla has emerged as the most popular four-wheeler in the market for second-hand electric cars. It occupies over 25% of the domestic market share, with sales jumping by 10.3% year-on-year in June 2024.
As per the Australian Automotive Dealer Association, in H1 of FY 2024-25, 1,112,580 used cars were sold in Australia, recording a substantial growth from 953,985 units in H1 of FY 2023-24. The prices of second-hand cars have reduced by 8% across Australia, and the share of private sellers has soared to 67.5% from 59.9% in June 2023, reaching 817,751 listings. The increase in Asia Pacific used car market value can be further attributed to the increasing demand for electric vehicles in the region, with EV listings recording a y-o-y growth of 75% in H1 of 2024-25, accounting for 0.8% of the market share.

The EMR’s report titled “Asia Pacific Used Car Market Report and Forecast 2025-2034” offers a detailed analysis of the market based on the following segments:
Market Breakup by Vehicle Type:
Market Breakup by Fuel Type:
Market Breakup by Vendor Type:
Market Breakup by Application:
Market Breakup by Country:
| CAGR 2025-2034 - Market by | Country |
| India | 9.5% |
| China | 8.9% |
| Japan | XX% |
| ASEAN | XX% |
| Australia | XX% |
| Others | XX% |
Based on country, the market is segmented into China, Japan, India, ASEAN, and Australia, among others. India is projected to dominate the market, representing 12.3% of the overall market share. The demand for used cars in India is expected to grow at a CAGR of 9.5%, due to the growing accessibility to simple financing options for vehicle buyers. Moreover, the growing presence of second-hand vehicle dealerships on digital platforms is expected to complement the market growth.
Major players are introducing new electric SUV models to capture a growing Asia Pacific used car market share.
Autotrader, Inc. was founded in 1998 and is headquartered in Georgia, United States. It is engaged in offering digital marketing solutions for automotives for used and new car dealerships.
Cars24 Services Private Limited was founded in 2015 and is headquartered in Haryana, India. As per Asia Pacific used car market analysis, it is an AutoTech company which is engaged in streamlining the financing, sale, and purchase of used cars in India, UAE, and Australia.
OTOPAC Motors Pte Ltd. was founded in 2016 and is headquartered in Jakarta Barat, Indonesia. It is engaged in providing automotive repair services such as tyre changes, replacement of window wipers and brake pads, and AC services, among others.
Uxin Limited was founded in 2011 and is headquartered in Beijing, China. It is the nation’s largest online platform for used car dealerships. It offers C2B, B2C, and B2B services through brands like Uxin Used Car and Uxin Auction.
*Please note that this is only a partial list; the complete list of key players is available in the full report. Additionally, the list of key players can be customized to better suit your needs.*
Other players included in the Asia Pacific used car market report are Vroom, Inc., Alibaba Group Holding Ltd, CarDekho, CAR Group Limited, ClickCar Australia Pty Ltd., and USS Co. Ltd., among others.
*While we strive to always give you current and accurate information, the numbers depicted on the website are indicative and may differ from the actual numbers in the main report. At Expert Market Research, we aim to bring you the latest insights and trends in the market. Using our analyses and forecasts, stakeholders can understand the market dynamics, navigate challenges, and capitalize on opportunities to make data-driven strategic decisions.*
Get in touch with us for a customized solution tailored to your unique requirements and save upto 35%!
In 2024, the market reached an approximate value of USD 793.30 Billion.
The market is projected to grow at a CAGR of 8.30% between 2025 and 2034.
The different countries considered in the Asia Pacific used car market report include China, Japan, India, ASEAN, and Australia, among others.
The different types of vehicles in the market are hatchbacks, sedans, and SUVs, among others.
The different vehicles based on fuel type include diesel, petrol, and electric, among others.
The different sales channels in the market are online and offline.
Key players in the market are Autotrader, Inc., Vroom, Inc., Alibaba Group Holding Ltd, CarDekho, Cars24 Services Private Limited, Uxin Limited, OTOPAC Motors Pte Ltd., CAR Group Limited, ClickCar Australia Pty Ltd., and USS Co. Ltd., among others.
The market is estimated to witness healthy growth in the forecast period of 2025-2034 to reach a value of around USD 1760.85 Billion by 2034.
Explore our key highlights of the report and gain a concise overview of key findings, trends, and actionable insights that will empower your strategic decisions.
| REPORT FEATURES | DETAILS |
| Base Year | 2024 |
| Historical Period | 2018-2024 |
| Forecast Period | 2025-2034 |
| Scope of the Report |
Historical and Forecast Trends, Industry Drivers and Constraints, Historical and Forecast Market Analysis by Segment:
|
| Breakup by Vehicle Type |
|
| Breakup by Fuel Type |
|
| Breakup by Vendor Type |
|
| Breakup by Sales Channel |
|
| Breakup by Region |
|
| Market Dynamics |
|
| Competitive Landscape |
|
| Companies Covered |
|
Datasheet
One User
USD 2,499
USD 2,249
tax inclusive*
Single User License
One User
USD 3,999
USD 3,599
tax inclusive*
Five User License
Five User
USD 4,999
USD 4,249
tax inclusive*
Corporate License
Unlimited Users
USD 5,999
USD 5,099
tax inclusive*
*Please note that the prices mentioned below are starting prices for each bundle type. Kindly contact our team for further details.*
Flash Bundle
Small Business Bundle
Growth Bundle
Enterprise Bundle
*Please note that the prices mentioned below are starting prices for each bundle type. Kindly contact our team for further details.*
Flash Bundle
Number of Reports: 3
20%
tax inclusive*
Small Business Bundle
Number of Reports: 5
25%
tax inclusive*
Growth Bundle
Number of Reports: 8
30%
tax inclusive*
Enterprise Bundle
Number of Reports: 10
35%
tax inclusive*
How To Order
Our step-by-step guide will help you select, purchase, and access your reports swiftly, ensuring you get the information that drives your decisions, right when you need it.

Select License Type
Choose the right license for your needs and access rights.

Click on ‘Buy Now’
Add the report to your cart with one click and proceed to register.

Select Mode of Payment
Choose a payment option for a secure checkout. You will be redirected accordingly.
Track prices with detailed trend reports.

Analyse trade data for supply chain insights.

Leverage cost reports for smart savings

Enhance supply chain with partnerships.

Gain insights to stay ahead and seize opportunities.

Get insights & trends for a competitive edge.

Track prices with detailed trend reports.
Analyse trade data for supply chain insights.
Leverage cost reports for smart savings
Enhance supply chain with partnerships.
Gain insights to stay ahead and seize opportunities.
Get insights & trends for a competitive edge.
Track prices with detailed trend reports.
Analyse trade data for supply chain insights.
Connect For More Information
Our expert team of analysts will offer full support and resolve any queries regarding the report, before and after the purchase.
Our expert team of analysts will offer full support and resolve any queries regarding the report, before and after the purchase.
We employ meticulous research methods, blending advanced analytics and expert insights to deliver accurate, actionable industry intelligence, staying ahead of competitors.
Our skilled analysts offer unparalleled competitive advantage with detailed insights on current and emerging markets, ensuring your strategic edge.
We offer an in-depth yet simplified presentation of industry insights and analysis to meet your specific requirements effectively.
Australia
63 Fiona Drive, Tamworth, NSW
+61-448-061-727
India
C130 Sector 2 Noida, Uttar Pradesh 201301
+91-723-689-1189
Philippines
40th Floor, PBCom Tower, 6795 Ayala Avenue Cor V.A Rufino St. Makati City,1226.
+63-287-899-028, +63-967-048-3306
United Kingdom
6 Gardner Place, Becketts Close, Feltham TW14 0BX, Greater London
+44-753-713-2163
United States
30 North Gould Street, Sheridan, WY 82801
+1-415-325-5166
Vietnam
193/26/4 St.no.6, Ward Binh Hung Hoa, Binh Tan District, Ho Chi Minh City
+84-865-399-124
United States (Head Office)
30 North Gould Street, Sheridan, WY 82801
+1-415-325-5166
Australia
63 Fiona Drive, Tamworth, NSW
+61-448-061-727
India
C130 Sector 2 Noida, Uttar Pradesh 201301
+91-723-689-1189
Philippines
40th Floor, PBCom Tower, 6795 Ayala Avenue Cor V.A Rufino St. Makati City, 1226.
+63-287-899-028, +63-967-048-3306
United Kingdom
6 Gardner Place, Becketts Close, Feltham TW14 0BX, Greater London
+44-753-713-2163
Vietnam
193/26/4 St.no.6, Ward Binh Hung Hoa, Binh Tan District, Ho Chi Minh City
+84-865-399-124


Share