

Consumer Insights
Uncover trends and behaviors shaping consumer choices today
Procurement Insights
Optimize your sourcing strategy with key market data
Industry Stats
Stay ahead with the latest trends and market analysis.
Trending Now


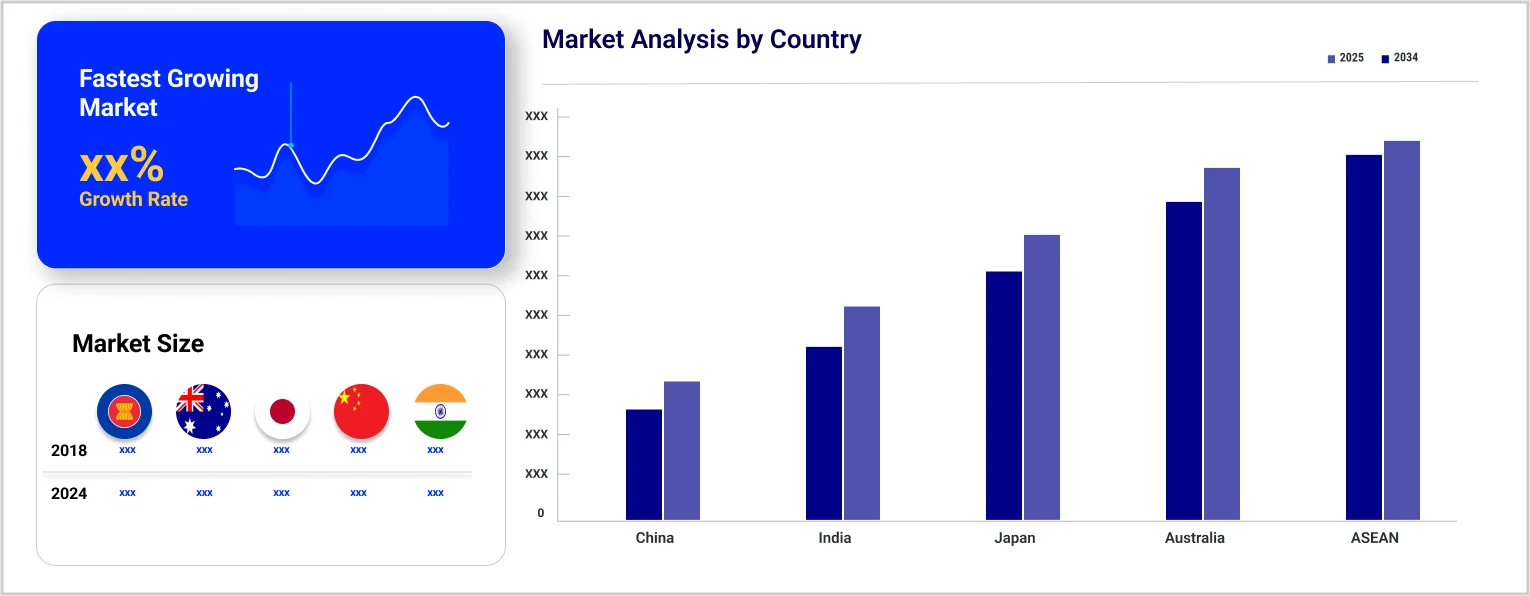
The Asia Pacific television market is projected to grow at a CAGR of 4.70% between 2025 and 2034.
Base Year
Historical Period
Forecast Period
As of 2024, the smart TV shipment accounts for 93 per cent of the total TV shipments in India.
According to the survey conducted by Trade Desk in 2022, around 34 per cent of Southeast Asian viewers stream over-the-top (OTT), creating a lucrative landscape for smart TVs in this region.
Samsung announced the launch of Neo QLED 8K, an AI-powered smart TV, in India in April 2024. This TV range is equipped with functionalities such as cloud gaming and education hubs, making it stand out in the market.


Value in USD Million
2025-2034
Asia Pacific Television Market Outlook
*this image is indicative*
The rising prevalence of streaming platforms such as Amazon Prime, Viki, Pooq, and Hotstar, among others, the availability of LED and LCD TVs at affordable pricing, and the growing demand for large-screen TVs are some of the prominent drivers boosting the demand of Asia Pacific television market. Several Asian customers are showing a preference for TV sizes above 55 inches to create an immersive environment and improve the viewing experience.
The proliferation of the internet and the rise of the e-commerce sector have facilitated the online sales of TV as a large number of online retailers offer a broad range of brands, features, and price ranges to customers. Online channel maintains their position as the top three distribution channels in the region, along with traditional trade and supermarkets, offering ample opportunities for TV sales.

Integration of smart AI features, high expenditure on consumer electronic goods, growing hospitality industry, and economical OTT subscriptions for home devices are accelerating the overall Asia Pacific television market value.
With growing technological advancements in the Asia-Pacific region, the adoption of smart televisions with integrated AI features has become rampant. Key market players are increasingly investing in this domain, eyeing future growth and stability. For instance, Samsung, a leading television supplier in the region, unveiled its new AI TV range in major countries like India, Australia, and New Zealand in the year 2024.
According to the US Energy Information Administration (EIA), the disposable income in the region, which amounted to USD 8,187 in 2022 is projected to grow by 3.1% up to 2050. The rising disposable incomes along with high expenditure on consumer electronic goods is expected to surge the demand for high-end, smart and high-definition television models.
The expanding hospitality industry is another key driver for the growth of the Asia Pacific television market. Hotels, resorts, and Airbnb apartments are increasingly investing in premium television sets, particularly smart TVs, to enhance guest experiences. According to the UN Tourism, the region registered a recovery in tourist visits by 82% since the pre-pandemic levels during the first quarter of 2024. As the trend further continues, the demand for televisions in the hospitality industry is expected to witness a sharp growth.
Leading OTT platforms such as Netflix, Amazon, and Disney+ Hotstar are providing economical packages to live stream their services on televisions. This coupled with the urge for watching shows on large screens has further increased the demand for smart televisions, thereby increasing their overall consumption in the Asia Pacific television market.
“Asia Pacific Television Market Report and Forecast 2025-2034” offers a detailed analysis of the market based on the following segments:
Market Breakup by Type:
Market Breakup by Distribution Channel:
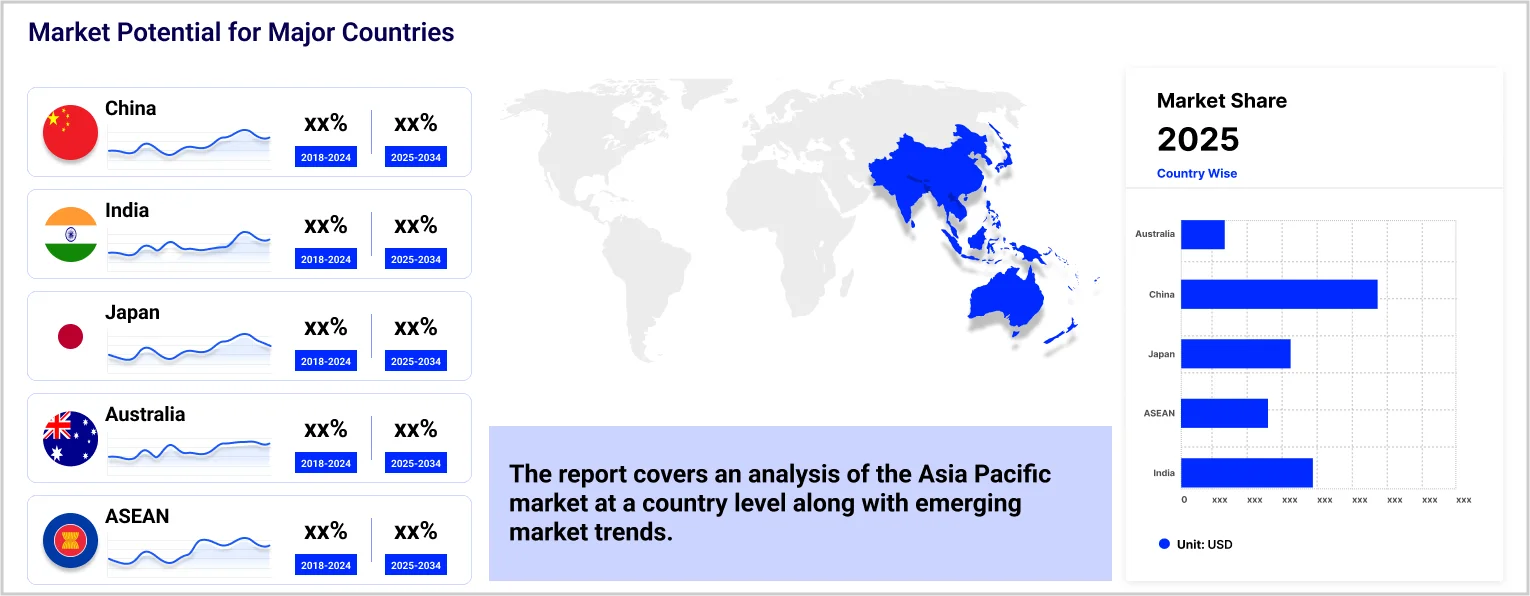
Market Breakup by Country:
Based on type, the market is divided into smart TV, LCD, plasma, and LED TVs, and cathode-ray tube (CRT) and rear-projection TVs. Smart TVs account for a substantial market share as they offer the provision of internet connectivity, on-demand streaming, as well as access to OTT applications and platforms. It can also allow users to browse through YouTube, listen to music, access the web, scroll through social media, and even sync with other smart devices such as Amazon Alexa and Google Nest.
The market players are readily launching TVs with sophisticated features and affordable pricing to gain a competitive edge in the market.
*While we strive to always give you current and accurate information, the numbers depicted on the website are indicative and may differ from the actual numbers in the main report. At Expert Market Research, we aim to bring you the latest insights and trends in the market. Using our analyses and forecasts, stakeholders can understand the market dynamics, navigate challenges, and capitalize on opportunities to make data-driven strategic decisions.*
Get in touch with us for a customized solution tailored to your unique requirements and save upto 35%!
The market is estimated to grow at a CAGR of 4.70% between 2025 and 2034.
The market is being driven due to rising prevalence of streaming platforms such as Amazon Prime, Viki, Pooq, and Hotstar, among others, and the availability of LED and LCD TVs at affordable pricing.
The key trends aiding the market include the rise of the e-commerce sector, the growth of AI-powered TVs, and the surge in OLED technology.
Countries considered in the market are China, Japan, India, ASEAN, and Australia, among others.
Based on type, market segmentations include smart TV, LCD, plasma, and LED TVs, and cathode-Ray tube (CRT) and rear-projection TVs.
Different distribution channels are offline and online.
Smart TVs hold a prominent share of the market.
The major players in the market are Samsung Electronics Co., Ltd., LG Corp., Panasonic Holdings Corp., Sony Group Corp., Toshiba Corporation, Hisense International Co., Ltd., Haier Smart Home Co. Ltd., KONKA Group Co. Ltd., Sansui Electric Co., Ltd., Vizio Holding Corp., Hon. Hai Precision Industry Co., Ltd. (Sharp Corp.), and Micromax Informatics Ltd., among others.
Explore our key highlights of the report and gain a concise overview of key findings, trends, and actionable insights that will empower your strategic decisions.
| REPORT FEATURES | DETAILS |
| Base Year | 2024 |
| Historical Period | 2018-2024 |
| Forecast Period | 2025-2034 |
| Scope of the Report |
Historical and Forecast Trends, Industry Drivers and Constraints, Historical and Forecast Market Analysis by Segment:
|
| Breakup by Type |
|
| Breakup by Distribution Channel |
|
| Breakup by Region |
|
| Market Dynamics |
|
| Competitive Landscape |
|
| Companies Covered |
|
Datasheet
One User
USD 2,499
USD 2,249
tax inclusive*
Single User License
One User
USD 3,999
USD 3,599
tax inclusive*
Five User License
Five User
USD 4,999
USD 4,249
tax inclusive*
Corporate License
Unlimited Users
USD 5,999
USD 5,099
tax inclusive*
*Please note that the prices mentioned below are starting prices for each bundle type. Kindly contact our team for further details.*
Flash Bundle
Small Business Bundle
Growth Bundle
Enterprise Bundle
*Please note that the prices mentioned below are starting prices for each bundle type. Kindly contact our team for further details.*
Flash Bundle
Number of Reports: 3
20%
tax inclusive*
Small Business Bundle
Number of Reports: 5
25%
tax inclusive*
Growth Bundle
Number of Reports: 8
30%
tax inclusive*
Enterprise Bundle
Number of Reports: 10
35%
tax inclusive*
How To Order
Our step-by-step guide will help you select, purchase, and access your reports swiftly, ensuring you get the information that drives your decisions, right when you need it.

Select License Type
Choose the right license for your needs and access rights.

Click on ‘Buy Now’
Add the report to your cart with one click and proceed to register.

Select Mode of Payment
Choose a payment option for a secure checkout. You will be redirected accordingly.
Track prices with detailed trend reports.

Analyse trade data for supply chain insights.

Leverage cost reports for smart savings

Enhance supply chain with partnerships.

Gain insights to stay ahead and seize opportunities.

Get insights & trends for a competitive edge.

Track prices with detailed trend reports.
Analyse trade data for supply chain insights.
Leverage cost reports for smart savings
Enhance supply chain with partnerships.
Gain insights to stay ahead and seize opportunities.
Get insights & trends for a competitive edge.
Track prices with detailed trend reports.
Analyse trade data for supply chain insights.
Connect For More Information
Our expert team of analysts will offer full support and resolve any queries regarding the report, before and after the purchase.
Our expert team of analysts will offer full support and resolve any queries regarding the report, before and after the purchase.
We employ meticulous research methods, blending advanced analytics and expert insights to deliver accurate, actionable industry intelligence, staying ahead of competitors.
Our skilled analysts offer unparalleled competitive advantage with detailed insights on current and emerging markets, ensuring your strategic edge.
We offer an in-depth yet simplified presentation of industry insights and analysis to meet your specific requirements effectively.
Australia
63 Fiona Drive, Tamworth, NSW
+61-448-061-727
India
C130 Sector 2 Noida, Uttar Pradesh 201301
+91-723-689-1189
Philippines
40th Floor, PBCom Tower, 6795 Ayala Avenue Cor V.A Rufino St. Makati City,1226.
+63-287-899-028, +63-967-048-3306
United Kingdom
6 Gardner Place, Becketts Close, Feltham TW14 0BX, Greater London
+44-753-713-2163
United States
30 North Gould Street, Sheridan, WY 82801
+1-415-325-5166
Vietnam
193/26/4 St.no.6, Ward Binh Hung Hoa, Binh Tan District, Ho Chi Minh City
+84-865-399-124
United States (Head Office)
30 North Gould Street, Sheridan, WY 82801
+1-415-325-5166
Australia
63 Fiona Drive, Tamworth, NSW
+61-448-061-727
India
C130 Sector 2 Noida, Uttar Pradesh 201301
+91-723-689-1189
Philippines
40th Floor, PBCom Tower, 6795 Ayala Avenue Cor V.A Rufino St. Makati City, 1226.
+63-287-899-028, +63-967-048-3306
United Kingdom
6 Gardner Place, Becketts Close, Feltham TW14 0BX, Greater London
+44-753-713-2163
Vietnam
193/26/4 St.no.6, Ward Binh Hung Hoa, Binh Tan District, Ho Chi Minh City
+84-865-399-124


Share