

Consumer Insights
Uncover trends and behaviors shaping consumer choices today
Procurement Insights
Optimize your sourcing strategy with key market data
Industry Stats
Stay ahead with the latest trends and market analysis.

The Asia Pacific socks market reached approximately USD 24.27 Billion in 2025. The market is projected to grow at a CAGR of 6.50% between 2026 and 2035, reaching a value of around USD 45.56 Billion by 2035.
Base Year
Historical Period
Forecast Period
The ecommerce market value in the Asia Pacific region is projected to exceed USD$28.9 trillion by the year 2026.
In 2023, NAIGAI, a company specialising in glove design and manufacturing, introduced high-quality socks aimed at addressing the challenges faced by the elderly, pregnant women, and individuals with disabilities.
It is anticipated that Asian consumers will represent 50 per cent of the global consumption growth over the next ten years, presenting a consumption growth opportunity valued at $10 trillion.
Compound Annual Growth Rate
6.5%
Value in USD Billion
2026-2035
*this image is indicative*
| Asia Pacific Socks Market Report Summary | Description | Value |
| Base Year | USD Billion | 2025 |
| Historical Period | USD Billion | 2019-2025 |
| Forecast Period | USD Billion | 2026-2035 |
| Market Size 2025 | USD Billion | 24.27 |
| Market Size 2035 | USD Billion | 45.56 |
| CAGR 2019-2025 | Percentage | XX% |
| CAGR 2026-2035 | Percentage | 6.50% |
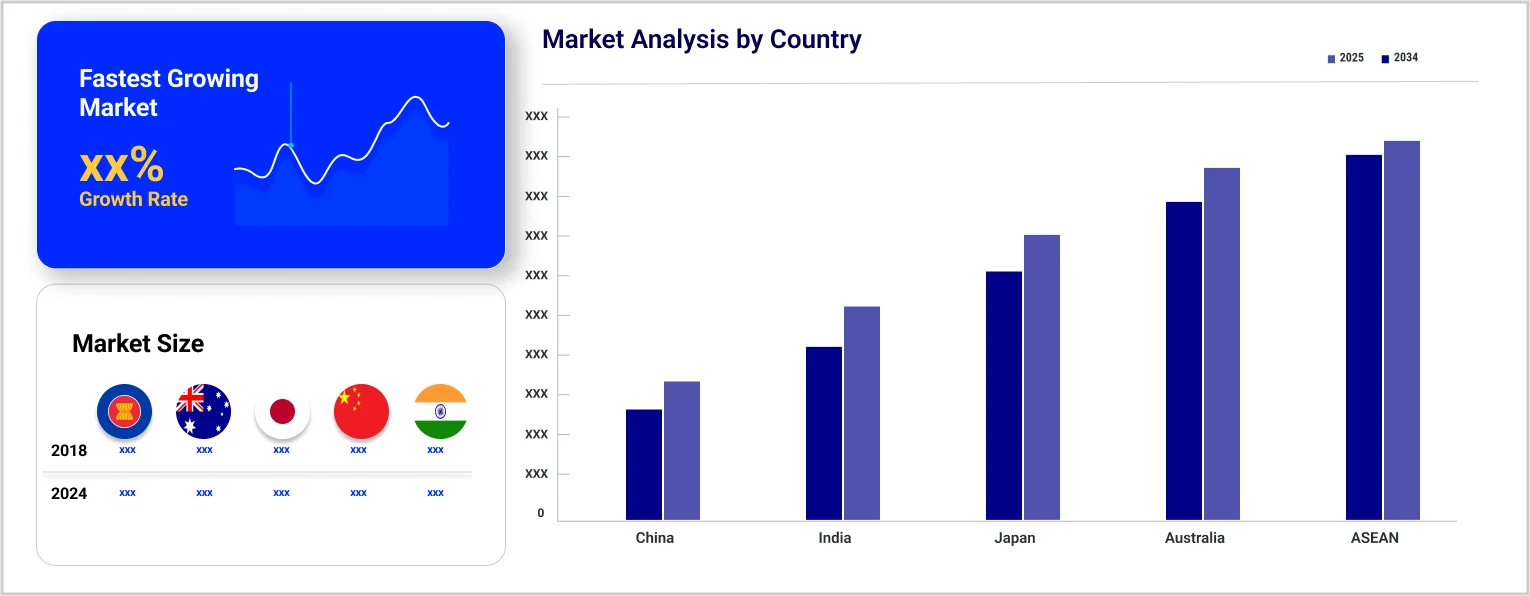
| CAGR 2026-2035 - Market by Region | India | 7.6% |
| CAGR 2026-2035 - Market by Region | ASEAN | 7.1% |
| CAGR 2026-2035 - Market by Product Type | Athletic Socks | 7.4% |
| CAGR 2026-2035 - Market by Distribution Channel | Online Channels | 11.7% |
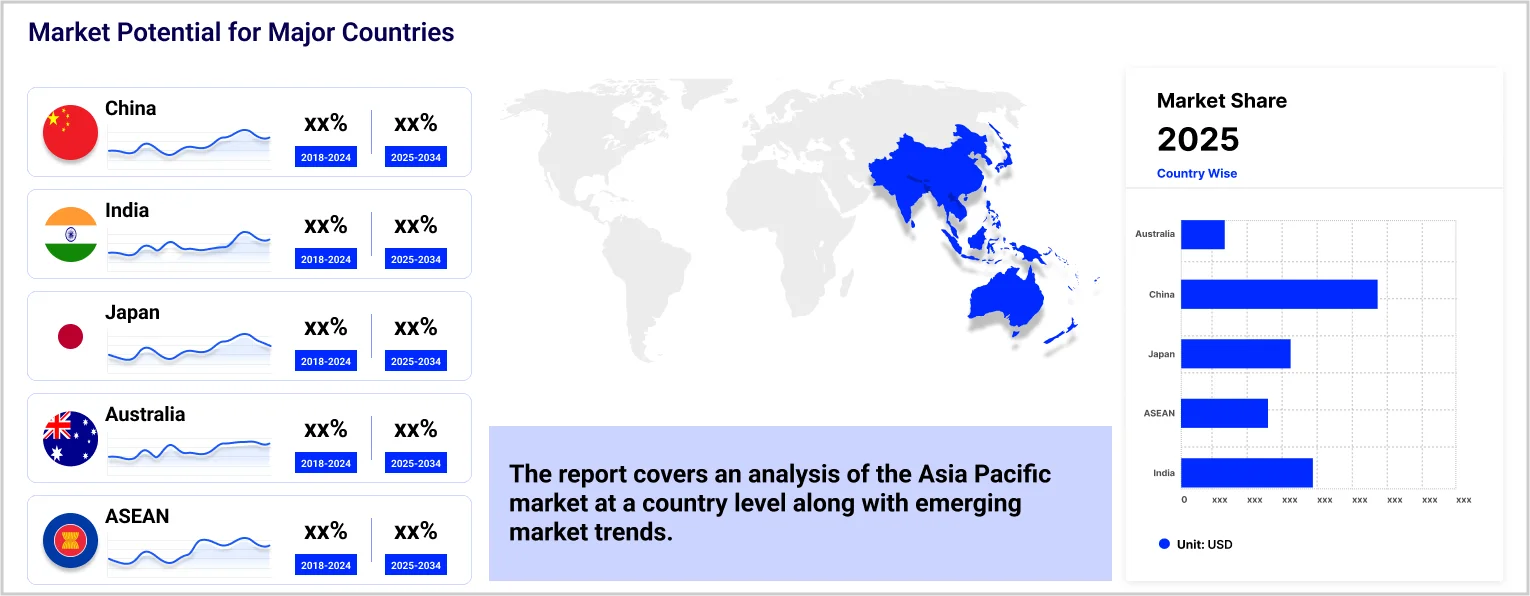
| 2025 Market Share by Country | Japan | 13.6% |
Business-to-business e-commerce in the expansive Asia Pacific has seen a steady annual growth rate of 15%, surpassing the global average of 14.5% in gross merchandise value growth each year. The expansion of e-commerce significantly contributes to the increasing demand for consumer products. Online shopping platforms are accessible 24/7, enabling customers to buy products, including socks, at their leisure without being constrained by store operating hours. The convenience of doorstep delivery removes the necessity of visiting physical stores, facilitating regular purchases of socks for consumers.
Japan occupies a significant share of the market due to its population's commitment to fitness and physical activity. According to the 2022 SSF National Sports-Life Survey, 72.9% of individuals in Japan engaged in sports and physical activities at least once during the year. Moreover, 49.1% of the population participated in sports at least twice a week in 2022. Walking is an integral part of Japanese culture, with many individuals covering considerable distances daily, which serves as an excellent form of cardiovascular exercise. In addition, activities such as calisthenics and traditional dance contribute to physical fitness without the need for structured exercise programmes. The increasing involvement in these outdoor and physical activities has led to a growing demand for specialised fitness socks that combine functionality with style.

“Asia Pacific Socks Market Report and Forecast 2026-2035” offers a detailed analysis of the market based on the following segments:
Market Breakup by Product Type
Market Breakup by Material Type
Market Breakup by Demographics
Market Breakup by Distribution Channel
Market Breakup by Country
| CAGR 2026-2035 - Market by | Country |
| India | 7.6% |
| ASEAN | 7.1% |
| China | XX% |
| Japan | XX% |
| Australia | XX% |
| Others | XX% |
Based on the distribution channel, the market is segmented into hypermarkets/supermarkets, convenience stores, and online channels, among others. Online channels are projected to grow at a CAGR of 11.7% during the forecast period of 2026-2035. Online shopping offers consumers unparalleled convenience, allowing them to browse and purchase a diverse array of sock options from the comfort of their own homes.
| 2025 Market Share by | Country |
| Japan | 13.6% |
| Australia | 4.8% |
| China | XX% |
| India | XX% |
| ASEAN | XX% |
| Others | XX% |
Major players are focusing on product innovation and ethical production practices to gain a competitive edge in the market.


Upto 15% Off
USD
$2499 $2249
$3999 $3599
$4999 $4249
$5999 $5099


*While we strive to always give you current and accurate information, the numbers depicted on the website are indicative and may differ from the actual numbers in the main report. At Expert Market Research, we aim to bring you the latest insights and trends in the market. Using our analyses and forecasts, stakeholders can understand the market dynamics, navigate challenges, and capitalize on opportunities to make data-driven strategic decisions.*
Get in touch with us for a customized solution tailored to your unique requirements and save upto 35%!
In 2025, the market reached an approximate value of USD 24.27 Billion.
The market is estimated to grow at a CAGR of 6.50% between 2026 and 2035.
The market is estimated to witness a healthy growth during 2026-2035 to reach around USD 45.56 Billion by 2035.
The market is being driven by rising disposable income, increasing spending on consumer goods, and rising health and fitness awareness.
The key trends aiding the market expansion include the growth of online sales channels and rising brand endorsements by athletes.
The different distribution channels of socks include hypermarkets/supermarkets, convenience stores, and online channels, among others.
The major countries included in the market are China, Japan, India, ASEAN, and Australia, among others.
The major players in the market are Nike, Inc., Adidas AG, Puma SE, U.S.Polo Assn., New Balance Athletics, Inc., YONEX Co., Ltd., Li-Ning Studio LLP, Under Armour, Inc., Tutuanna Co., Ltd., and ZHEJIANG JASAN HOLDING GROUP CO., LTD., among others.
Explore our key highlights of the report and gain a concise overview of key findings, trends, and actionable insights that will empower your strategic decisions.
| REPORT FEATURES | DETAILS |
| Base Year | 2025 |
| Historical Period | 2019-2025 |
| Forecast Period | 2026-2035 |
| Scope of the Report |
Historical and Forecast Trends, Industry Drivers and Constraints, Historical and Forecast Market Analysis by Segment:
|
| Breakup by Product Type |
|
| Breakup by Material Type |
|
| Breakup by Demographics |
|
| Breakup by Distribution Channel |
|
| Breakup by Region |
|
| Market Dynamics |
|
| Competitive Landscape |
|
| Companies Covered |
|
Datasheet
One User
USD 2,499
USD 2,249
tax inclusive*
Single User License
One User
USD 3,999
USD 3,599
tax inclusive*
Five User License
Five User
USD 4,999
USD 4,249
tax inclusive*
Corporate License
Unlimited Users
USD 5,999
USD 5,099
tax inclusive*
*Please note that the prices mentioned below are starting prices for each bundle type. Kindly contact our team for further details.*
Flash Bundle
Small Business Bundle
Growth Bundle
Enterprise Bundle
*Please note that the prices mentioned below are starting prices for each bundle type. Kindly contact our team for further details.*
Flash Bundle
Number of Reports: 3
20%
tax inclusive*
Small Business Bundle
Number of Reports: 5
25%
tax inclusive*
Growth Bundle
Number of Reports: 8
30%
tax inclusive*
Enterprise Bundle
Number of Reports: 10
35%
tax inclusive*
How To Order

Select License Type
Choose the right license for your needs and access rights.

Click on ‘Buy Now’
Add the report to your cart with one click and proceed to register.

Select Mode of Payment
Choose a payment option for a secure checkout. You will be redirected accordingly.
Gain insights to stay ahead and seize opportunities.

Get insights & trends for a competitive edge.

Track prices with detailed trend reports.

Analyse trade data for supply chain insights.

Leverage cost reports for smart savings

Enhance supply chain with partnerships.

Connect For More Information
Our expert team of analysts will offer full support and resolve any queries regarding the report, before and after the purchase.
Our expert team of analysts will offer full support and resolve any queries regarding the report, before and after the purchase.
We employ meticulous research methods, blending advanced analytics and expert insights to deliver accurate, actionable industry intelligence, staying ahead of competitors.
Our skilled analysts offer unparalleled competitive advantage with detailed insights on current and emerging markets, ensuring your strategic edge.
We offer an in-depth yet simplified presentation of industry insights and analysis to meet your specific requirements effectively.


Share