

Consumer Insights
Uncover trends and behaviors shaping consumer choices today
Procurement Insights
Optimize your sourcing strategy with key market data
Industry Stats
Stay ahead with the latest trends and market analysis.
Trending Now


Base Year
Historical Year
Forecast Year


The Asia Pacific silica sand market reached a value of about USD 7.69 billion in 2024. The industry is further expected to grow at a CAGR of about 6.80% in the forecast period of 2025-2034.

Read more about this report - REQUEST FREE SAMPLE COPY IN PDF
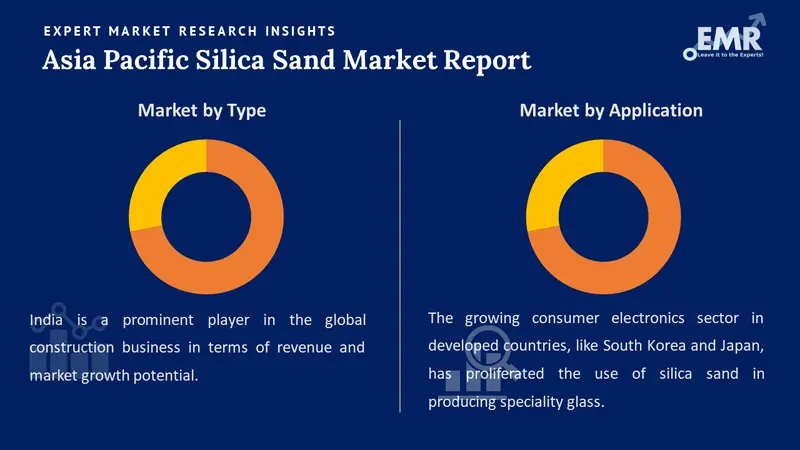
Sand, along with marble, clay, and other minor minerals, is classified as a minor mineral by the Indian Ministry of Mines. Silica sand is used in India for a variety of purposes, including glass creation in foundries, chemical production, construction, and paints. India is a prominent player in the global construction business in terms of revenue and market growth potential. This has boosted demand for silica sand in India by increasing demand for commercial structures, shopping malls, arenas, high-rise buildings, and hotels. Due to India's rising construction and foundry industries, the silica sand market is predicted to rise at a healthy rate. The glass industry of the countries, such as China and India, will continue to improve silica sand consumption for the production of electronic displays, windows, glass bottles, photovoltaic panels, and many other flat glass products. Additionally, in India, foundry activities are increasing at a rapid pace, impelling the production of sand moulds to manufacture machine tools, automotive, wind turbines, and other types of metal castings.

Silica sand, also known as industrial sand, is made up mostly of quartz and other components, such as feldspars, carbonates, clay minerals, iron oxides, and so on. Glassmaking, hydraulic fracturing, water filtering, industrial casting, sandblasting, and other industries use silica sand. This can be attributed to a variety of advantages, including high granularity, strength, durability, and higher resistance to heat and chemical reactions, among others.
Read more about this report - REQUEST FREE SAMPLE COPY IN PDF
By type, the market includes:
The significant applications of the market are:
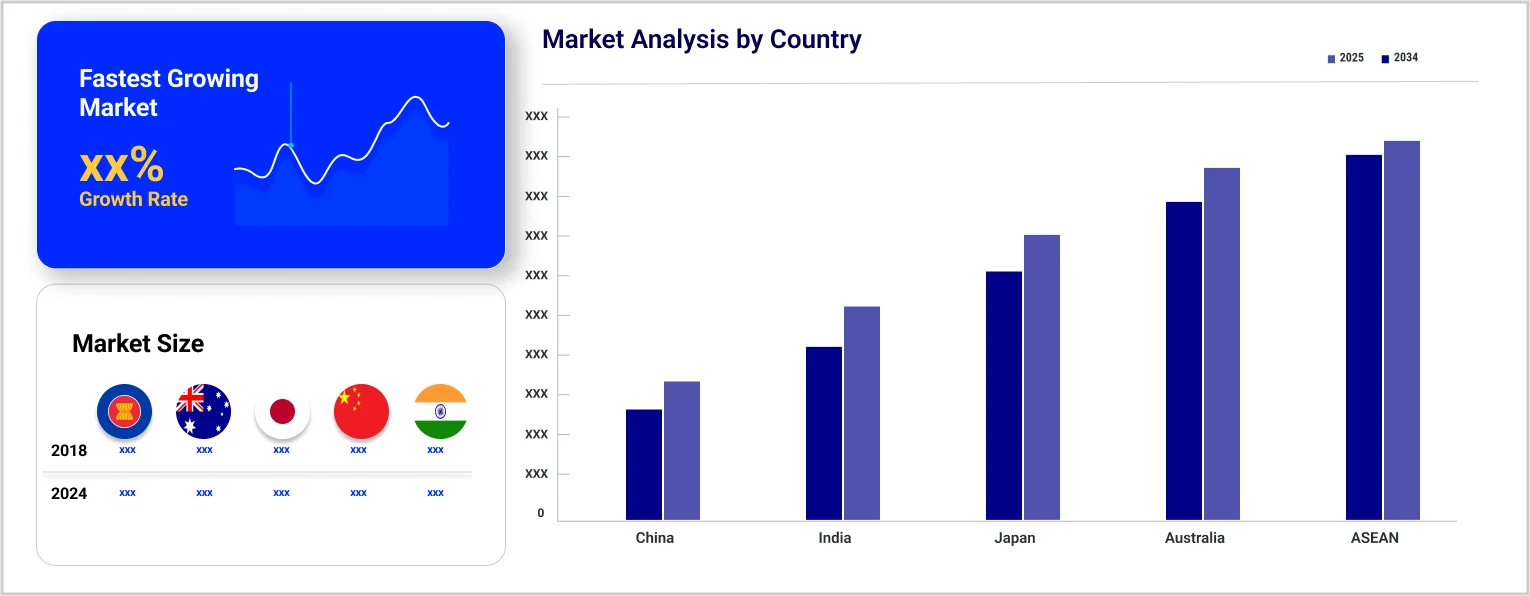
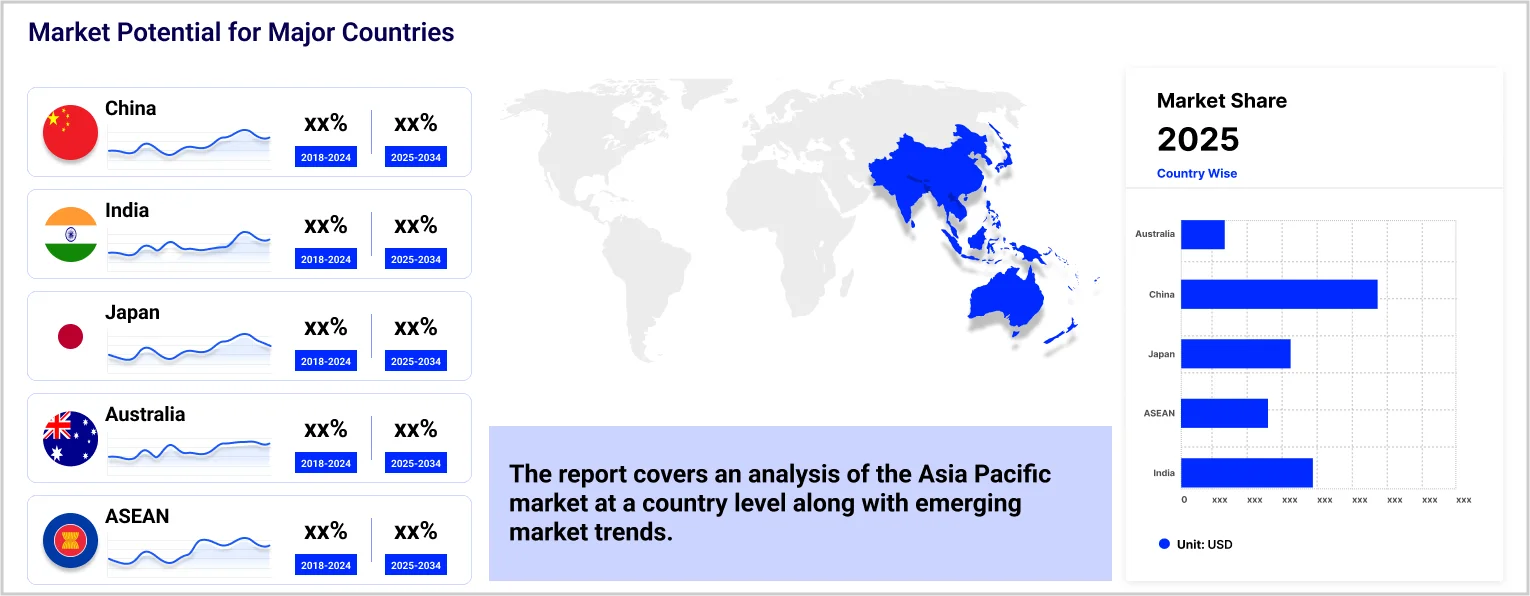
The countries for the silica sand industry can be divided into China, India, Japan, South Korea, ASEAN, and Australia, among others.
Read more about this report - REQUEST FREE SAMPLE COPY IN PDF
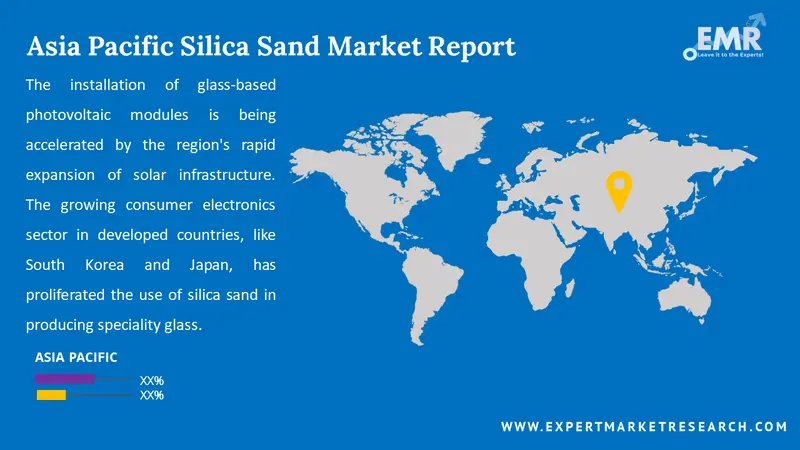
The Asia Pacific silica sand industry is growing due to increased demand for high purity silica sand in the manufacture of solar panels and silicon-metal composite materials. The installation of glass-based photovoltaic modules is being accelerated by the region's rapid expansion of solar infrastructure. The growing consumer electronics sector in developed countries, like South Korea and Japan, has proliferated the use of silica sand in producing speciality glass. The expanding construction industry, coupled with rising per capita income, increasing automotive production and sales, and technological advancements, has significantly increased the use of silica sand in manufacturing various building materials. Rapid urbanisation has propelled the demand for high-grade construction materials in residential and commercial sectors. Also, the growing infrastructural investments in various Asia Pacific countries, such as China, India, Japan, South Korea, and Vietnam, among others, are driving the market growth. Apart from this, silica sand is also utilised during hydraulic fracturing. Numerous shale gas exploration activities, particularly in Australia and China, are bolstering the region's silica sand market.
The report gives a detailed analysis of the following key players in the Asia Pacific silica sand industry, covering their competitive landscape, capacity, and latest developments like mergers, acquisitions, and investments, expansions of capacity, and plant turnarounds:
The comprehensive EMR report provides an in-depth assessment of the market based on the Porter's five forces model along with giving a SWOT analysis.
| REPORT FEATURES | DETAILS |
| Base Year | 2023 |
| Historical Period | 2018-2024 |
| Forecast Period | 2025-2034 |
| Scope of the Report |
Historical and Forecast Trends, Industry Drivers and Constraints, Historical and Forecast Market Analysis by Segment:
|
| Breakup by Type |
|
| Breakup by Application |
|
| Breakup by Region |
|
| Market Dynamics |
|
| Trade Data Analysis |
|
| Price Analysis |
|
| Competitive Landscape |
|
| Companies Covered |
|
| Report Price and Purchase Option | Explore our purchase options that are best suited to your resources and industry needs. |
| Delivery Format | Delivered as an attached PDF and Excel through email, with an option of receiving an editable PPT, according to the purchase option. |
*While we strive to always give you current and accurate information, the numbers depicted on the website are indicative and may differ from the actual numbers in the main report. At Expert Market Research, we aim to bring you the latest insights and trends in the market. Using our analyses and forecasts, stakeholders can understand the market dynamics, navigate challenges, and capitalize on opportunities to make data-driven strategic decisions.*
Get in touch with us for a customized solution tailored to your unique requirements and save upto 35%!
In 2024, the Asia Pacific silica sand market attained a value of nearly USD 7.69 billion.
The market is projected to grow at a CAGR of 6.80% between 2025 and 2034.
The major drivers of the market include the growing consumer electronics sector, rising per capita income, increasing automotive production and sales, technological advancements, rapid urbanisation, growing infrastructural investments, and numerous shale gas exploration activities.
The increased demand for high purity silica sand in the manufacture of solar panels and the expanding construction industry are the key industry trends propelling the growth of the market.
The major regions in the industry are China, India, Japan, South Korea, ASEAN, and Australia, among others.
The different types of silica sand are wet sand and dry sand.
The significant applications of the market are glass industry, foundry, chemical production, filtration, oil and gas recovery, construction, ceramic and refractories, among others.
The major players in the industry are Chongqing Changjiang River Moulding Material (Group) Co., Ltd., Mitsubishi Corporation, PUM GROUP, JFE MINERAL Co., LTD., VRX Silica, Tochu Corporation, and All India Minerals, among others.
Single User License
One User
USD 3,999
USD 3,599
tax inclusive*
Datasheet
One User
USD 2,499
USD 2,249
tax inclusive*
Five User License
Five User
USD 4,999
USD 4,249
tax inclusive*
Corporate License
Unlimited Users
USD 5,999
USD 5,099
tax inclusive*
*Please note that the prices mentioned below are starting prices for each bundle type. Kindly contact our team for further details.*
Flash Bundle
Small Business Bundle
Growth Bundle
Enterprise Bundle
*Please note that the prices mentioned below are starting prices for each bundle type. Kindly contact our team for further details.*
Flash Bundle
Number of Reports: 3
20%
tax inclusive*
Small Business Bundle
Number of Reports: 5
25%
tax inclusive*
Growth Bundle
Number of Reports: 8
30%
tax inclusive*
Enterprise Bundle
Number of Reports: 10
35%
tax inclusive*
How To Order
Our step-by-step guide will help you select, purchase, and access your reports swiftly, ensuring you get the information that drives your decisions, right when you need it.

Select License Type
Choose the right license for your needs and access rights.

Click on ‘Buy Now’
Add the report to your cart with one click and proceed to register.

Select Mode of Payment
Choose a payment option for a secure checkout. You will be redirected accordingly.
Gain insights to stay ahead and seize opportunities.

Get insights & trends for a competitive edge.

Track prices with detailed trend reports.

Analyse trade data for supply chain insights.

Leverage cost reports for smart savings

Enhance supply chain with partnerships.

Connect For More Information
Our expert team of analysts will offer full support and resolve any queries regarding the report, before and after the purchase.
Our expert team of analysts will offer full support and resolve any queries regarding the report, before and after the purchase.
We employ meticulous research methods, blending advanced analytics and expert insights to deliver accurate, actionable industry intelligence, staying ahead of competitors.
Our skilled analysts offer unparalleled competitive advantage with detailed insights on current and emerging markets, ensuring your strategic edge.
We offer an in-depth yet simplified presentation of industry insights and analysis to meet your specific requirements effectively.
Australia
63 Fiona Drive, Tamworth, NSW
+61-448-061-727
India
C130 Sector 2 Noida, Uttar Pradesh 201301
+91-723-689-1189
Philippines
40th Floor, PBCom Tower, 6795 Ayala Avenue Cor V.A Rufino St. Makati City,1226.
+63-287-899-028, +63-967-048-3306
United Kingdom
6 Gardner Place, Becketts Close, Feltham TW14 0BX, Greater London
+44-753-713-2163
United States
30 North Gould Street, Sheridan, WY 82801
+1-415-325-5166
Vietnam
193/26/4 St.no.6, Ward Binh Hung Hoa, Binh Tan District, Ho Chi Minh City
+84-865-399-124
United States (Head Office)
30 North Gould Street, Sheridan, WY 82801
+1-415-325-5166
Australia
63 Fiona Drive, Tamworth, NSW
+61-448-061-727
India
C130 Sector 2 Noida, Uttar Pradesh 201301
+91-723-689-1189
Philippines
40th Floor, PBCom Tower, 6795 Ayala Avenue Cor V.A Rufino St. Makati City, 1226.
+63-287-899-028, +63-967-048-3306
United Kingdom
6 Gardner Place, Becketts Close, Feltham TW14 0BX, Greater London
+44-753-713-2163
Vietnam
193/26/4 St.no.6, Ward Binh Hung Hoa, Binh Tan District, Ho Chi Minh City
+84-865-399-124


Share