

Consumer Insights
Uncover trends and behaviors shaping consumer choices today
Procurement Insights
Optimize your sourcing strategy with key market data
Industry Stats
Stay ahead with the latest trends and market analysis.

The Asia Pacific razor market is projected to grow at a CAGR of 3.60% between 2026 and 2035. The market is being driven by the growing spending on grooming by men.
Base Year
Historical Period
Forecast Period
54% of Asian men regard their appearance as important, as compared to 44% of men in Western European countries.
An average man’s hair can have a diameter of 17-180 mm.
In 2018, South Korean men spent nearly $683 million on skincare, which accounted for one-fifth of the global spending.
Compound Annual Growth Rate
3.6%
2026-2035
*this image is indicative*
| Asia Pacific Razor Market Report Summary | Description | Value |
| Base Year | USD Million | 2025 |
| Historical Period | USD Million | 2019-2025 |
| Forecast Period | USD Million | 2026-2035 |
| Market Size 2025 | USD Million | XX |
| Market Size 2035 | USD Million | XX |
| CAGR 2019-2025 | Percentage | XX% |
| CAGR 2026-2035 | Percentage | 3.60% |
| CAGR 2026-2035 - Market by Country | India | 4.1% |
| CAGR 2026-2035 - Market by Country | China | 3.9% |
| CAGR 2026-2035 - Market by Product Type | Electric | 4.0% |
| CAGR 2026-2035 - Market by Distribution Channel | Online | 5.8% |
| 2025 Market Share by Country | India | 26.3% |
The desire to have smooth, pore-less, even-toned, and blemish-free skin among South Koreans has led to an increase in their expenditure on personal care and grooming products. In 2018, South Korean men spent 10 times more than their counterparts in France and the USA on skin care products. Beards are considered untidy and dirty among South Korea’s youth, and over 50% of men shave their beard/hair once daily. This is expected to attract major razor manufacturers to the country over the forecast period.
The rise of the burgeoning middle class and the increasing disposable incomes in China are expected to favour the demand for premium shaving products that ensure a safe and clean hair removal experience. In 2022, an average Chinese citizen’s per capita income recorded a year-on-year growth of 4.7%, to RMB 31,370. Furthermore, China is expected to account for over 60% of all sales of personal care and beauty products in the Asia Pacific by 2025, which is expected to make it a lucrative destination for the marketing of razors and other shaving products. Major market players are expected to benefit from advertising their products on live streams to drive sales since over 8% of all e-commerce sales of 2022 are attributed to it.
Rising interest in men’s grooming; the shift towards electric razors; advancements in blade technology; and the rising demand for sustainable razors are aiding the Asia Pacific razor market expansion.
The Asia Pacific is witnessing an unprecedented interest in men’s grooming, fuelled by rising disposable incomes, increasing digital connectivity, changing societal norms, and a growing focus on personal hygiene. This, coupled with the acceptance of beards as a fashion statement, is surging the demand for razors.
Electric razors are increasingly gaining popularity as they are durable, portable, easy to clean, deliver high-quality shave, protect sensitive skin, and eliminate the requirement for shaving cream or water.
Advancements in blade technology, the rising use of durable materials such as carbon fibres and ceramics in blade manufacturing, and the shift to multi-blade designs are leading to more precise and sharper cutting mechanisms, enhancing the shaving experience while reducing the risk of irritation.
Key players are adopting minimalist designs to reduce material usage in razor manufacturing and incorporating features such as precision engineering to enhance blade longevity, boosting the sustainability of razors.

There is a growing demand for safety and straight razors as alternatives to disposable razors due to their durability, recyclability, and minimal packaging created using recyclable and biodegradable materials. Such razors also use replaceable blades which can be recycled, lowering the environmental impact. Besides, razors made with innovative materials like bamboo, recycled ocean plastics, and cornstarch-made plastics are increasingly gaining popularity.
The demand for electric razors is significantly increasing as they offer precision grooming capabilities and address the needs of customers with different hair textures. Such razors are equipped with rechargeable batteries and contribute to a sustainable shaving routine. In the forecast period, electric razors are expected to deploy innovative technologies such as artificial intelligence to analyse user preferences and provide personalised recommendations to users.
Asia Pacific Razor Market Report and Forecast 2026-2035 offers a detailed analysis of the market based on the following segments:
Market Breakup by Product Type
Market Breakup by End User
Market Breakup by Distribution Channel
Market Breakup by Region
| CAGR 2026-2035 - Market by | Country |
| India | 4.1% |
| China | 3.9% |
| Japan | XX% |
| ASEAN | XX% |
| Australia | XX% |
| Others | XX% |
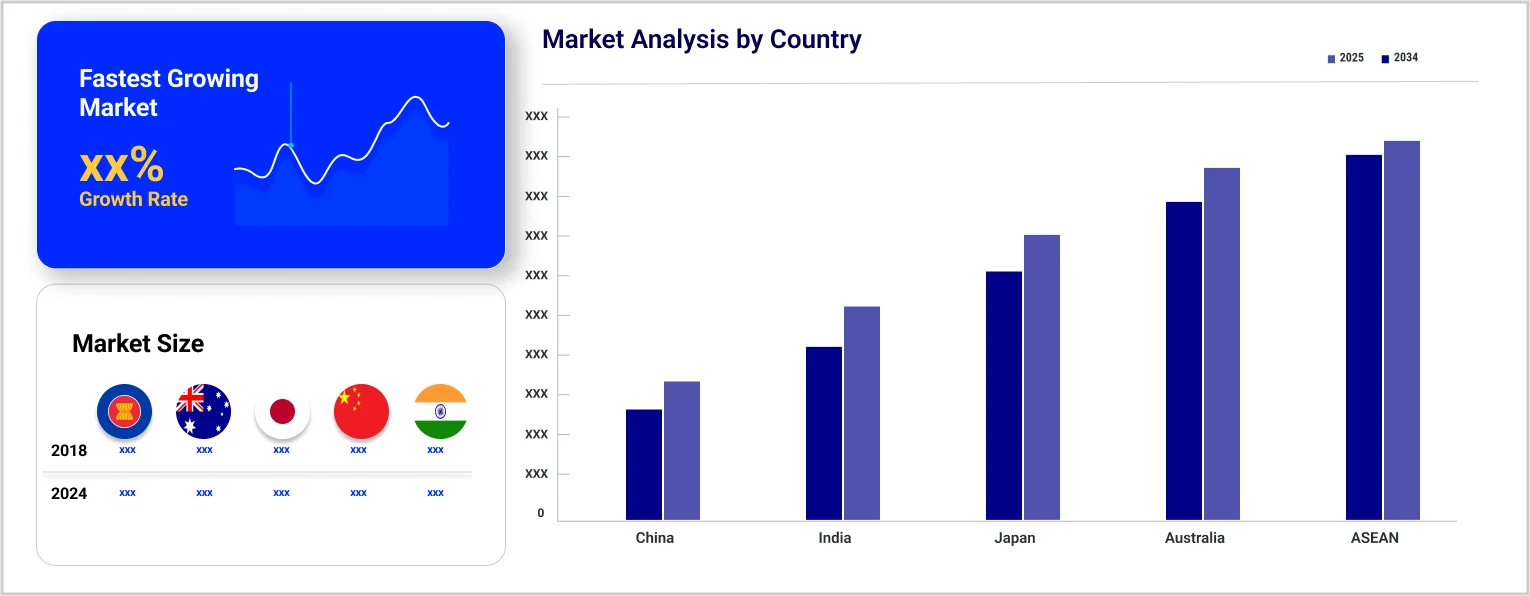
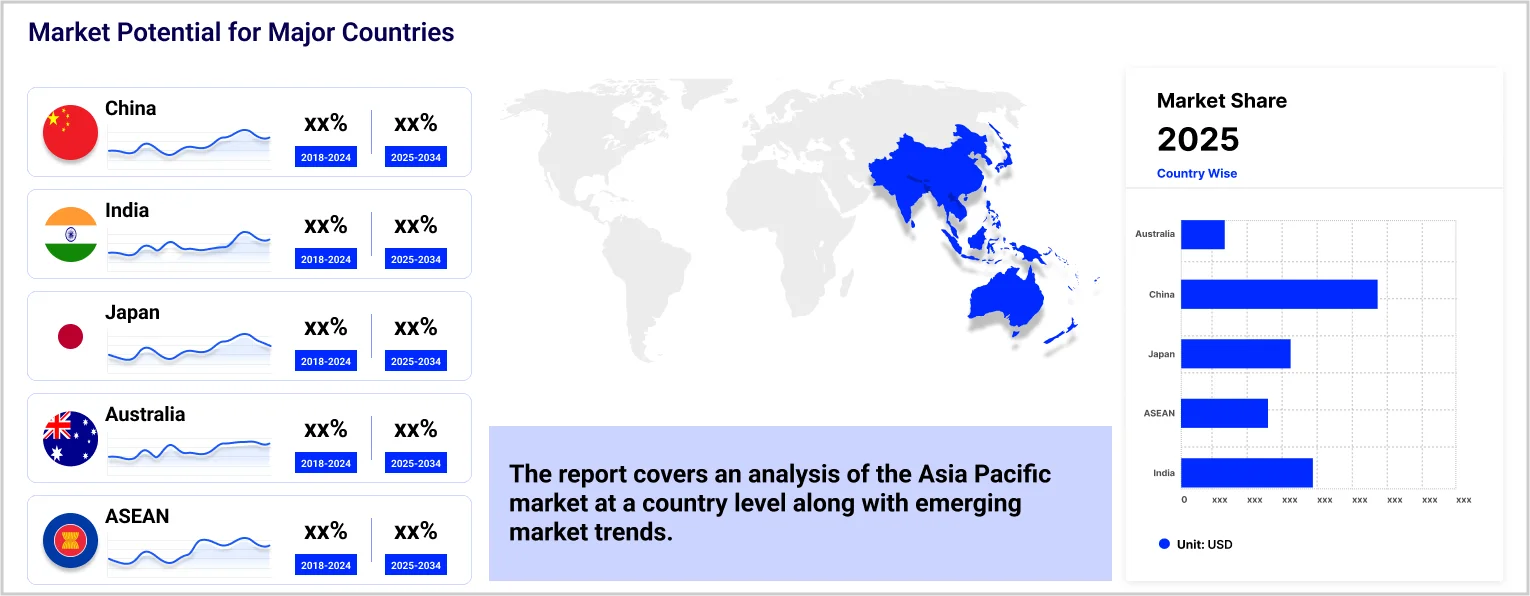
Based on region, the market is segmented into China, Japan, India, ASEAN, and Australia. India represented 26% of the overall market share in 2025. Over the forecast period, it is projected to grow at a CAGR of 4.1% between 2026 and 2035 amid rising disposable incomes of customers and increasing interest in grooming among men.
Cleanliness has emerged as a major trend in Japan’s male grooming and personal care industry, where men follow sophisticated skincare routines and prefer shaving products to achieve a clean appearance. The region is expected to enjoy a stable demand for razors over the forecast period.
The comprehensive report looks into the macro and micro aspects of the market. The EMR report gives an in-depth insight into the market by providing a SWOT analysis as well as an analysis of Porter’s Five Forces model.


Upto 15% Off
USD
$2499 $2249
$3999 $3599
$4999 $4249
$5999 $5099


*While we strive to always give you current and accurate information, the numbers depicted on the website are indicative and may differ from the actual numbers in the main report. At Expert Market Research, we aim to bring you the latest insights and trends in the market. Using our analyses and forecasts, stakeholders can understand the market dynamics, navigate challenges, and capitalize on opportunities to make data-driven strategic decisions.*
Get in touch with us for a customized solution tailored to your unique requirements and save upto 35%!
The market is assessed to grow at a CAGR of 3.60% between 2026 and 2035.
The different types of products in the market are cartridge, disposable, and electric.
The different distribution channels in the market are supermarkets and hypermarkets, convenience stores, and online, among others
The different end uses of razor include men and women.
The different countries covered in the market report are China, Japan, India, ASEAN, and Australia, among others.
The key market players are Procter & Gamble Co., Koninklijke Philips N.V., Edgewell Personal Care Co., Harry's Inc., Societe BIC S.A., Dorco Co. Ltd., Ningbo Kaili Holding Group Co., Ltd., KAI Corp., Dollar Shave Club, Inc., and FEATHER Safety Razor Co., Ltd., among others.
Explore our key highlights of the report and gain a concise overview of key findings, trends, and actionable insights that will empower your strategic decisions.
| REPORT FEATURES | DETAILS |
| Base Year | 2025 |
| Historical Period | 2019-2025 |
| Forecast Period | 2026-2035 |
| Scope of the Report |
Historical and Forecast Trends, Industry Drivers and Constraints, Historical and Forecast Market Analysis by Segment
|
| Breakup by Product Type |
|
| Breakup by Consumer |
|
| Breakup by Distribution Channel |
|
| Breakup by Region |
|
| Market Dynamics |
|
| Competitive Landscape |
|
| Companies Covered |
|
Datasheet
One User
USD 2,499
USD 2,249
tax inclusive*
Single User License
One User
USD 3,999
USD 3,599
tax inclusive*
Five User License
Five User
USD 4,999
USD 4,249
tax inclusive*
Corporate License
Unlimited Users
USD 5,999
USD 5,099
tax inclusive*
*Please note that the prices mentioned below are starting prices for each bundle type. Kindly contact our team for further details.*
Flash Bundle
Small Business Bundle
Growth Bundle
Enterprise Bundle
*Please note that the prices mentioned below are starting prices for each bundle type. Kindly contact our team for further details.*
Flash Bundle
Number of Reports: 3
20%
tax inclusive*
Small Business Bundle
Number of Reports: 5
25%
tax inclusive*
Growth Bundle
Number of Reports: 8
30%
tax inclusive*
Enterprise Bundle
Number of Reports: 10
35%
tax inclusive*
How To Order

Select License Type
Choose the right license for your needs and access rights.

Click on ‘Buy Now’
Add the report to your cart with one click and proceed to register.

Select Mode of Payment
Choose a payment option for a secure checkout. You will be redirected accordingly.
Gain insights to stay ahead and seize opportunities.

Get insights & trends for a competitive edge.

Track prices with detailed trend reports.

Analyse trade data for supply chain insights.

Leverage cost reports for smart savings

Enhance supply chain with partnerships.

Connect For More Information
Our expert team of analysts will offer full support and resolve any queries regarding the report, before and after the purchase.
Our expert team of analysts will offer full support and resolve any queries regarding the report, before and after the purchase.
We employ meticulous research methods, blending advanced analytics and expert insights to deliver accurate, actionable industry intelligence, staying ahead of competitors.
Our skilled analysts offer unparalleled competitive advantage with detailed insights on current and emerging markets, ensuring your strategic edge.
We offer an in-depth yet simplified presentation of industry insights and analysis to meet your specific requirements effectively.


Share