

Consumer Insights
Uncover trends and behaviors shaping consumer choices today
Procurement Insights
Optimize your sourcing strategy with key market data
Industry Stats
Stay ahead with the latest trends and market analysis.

The Asia Pacific media monitoring tools market was valued at USD 1.76 Billion in 2025. The industry is expected to grow at a CAGR of 16.80% during the forecast period of 2026-2035 to attain a valuation of USD 8.32 Billion by 2035.
Base Year
Historical Period
Forecast Period
As per the industry reports, the retail sector in India is expected to reach USD 2 trillion by 2032, fuelling the demand for media monitoring tools for brand reputation management.
The hotel occupancy rate in Singapore reached 75.8 per cent in 2022, which offers ample opportunities for reputation management tools and platforms.
The total number of private hospitals exceeds public hospitals in China as of 2024, creating increased demand for healthcare monitoring tools in private healthcare institutes.
Compound Annual Growth Rate
16.8%
Value in USD Billion
2026-2035
*this image is indicative*
The rising usage of social media platforms, growing demand for competitive intelligence, and increased implementation of real-time media analytics are some prominent drivers boosting the demand of Asia Pacific media monitoring tools market. Businesses are leveraging these tools to identify what their competitors are doing as well as identify the latest market trends so they can stay ahead in the market landscape. These tools also enable organisations to identify any potential crisis on time through alerts, further allowing them to take appropriate measures to minimise the adverse effects of that crisis.
The growth of startups and company branches in the region provides several opportunities for market growth. For instance, Malaysia registered an increase of 1,482,579 companies at the end of 2022, which fuels the demand for monitoring tools that can maintain the brand reputation and offer social media tracking to understand what the customers in that market domain are interested in.

Rising intraregional trade, increasing business competition, frequent shifts in trade patterns, and integration of advanced AI technologies are accelerating the Asia Pacific media monitoring tools market value.
The increasing intraregional trade in Asia Pacific, owing to new trade agreements between countries and tariff reductions by the regional governments, is propelling the growth of the Asia Pacific media monitoring tools market. According to the Asian Economic Integration Report 2022, issued by the Asian Development Bank ADB, intra-regional trade in the Asia Pacific region grew by 31.2% in 2021 compared to a relative contraction of 3.1% in the previous year. As the trade further rises, businesses will be encouraged to invest in media monitoring tools for better targeting of consumers, localization of content, and interactive engagement with buyers.
The Asia Pacific region is witnessing a rapid rise in the establishment of new startups owing to favourable government initiatives and efforts. This is causing increased business competition in the region, resulting in the media monitoring tools demand growth. Media monitoring tools help startups enhance their digital presence, optimise ad campaigns, and analyse consumer trends to facilitate an increased acquisition and retention of new customers.
Frequent geopolitical tensions and crises are resulting in shifting trade patterns within the region, leading to a rise in media monitoring tools consumption in Asia Pacific. These include tools which are known to provide an easier and more objective understanding of regional market dynamics, the consequent evolution of consumer behaviour, and the development of efficient marketing strategies based on regional content. As the trade patterns witness a further shift in Asia Pacific countries, the market is expected to experience increased sales volume, adding to its overall revenue growth.
Technological advancements in the Asia Pacific are prompting key players to invest in the development of AI-based media monitoring tools. For instance, the Asia-based ADA company launched AI CoPilots in May 2024, a platform that uses vast databases and AI models to help develop efficient marketing campaigns and e-commerce strategies. A rise in the development of such platforms is expected to enhance the overall productivity of the media monitoring tools industry in Asia Pacific.
“Asia Pacific Media Monitoring Tools Market Report and Forecast 2026-2035” offers a detailed analysis of the market based on the following segments:
Market Breakup by Component
Market Breakup by Enterprise Size
Market Breakup by Industry Vertical
Market Breakup by Country
Based on industry vertical, the market is divided into IT and telecom, hospitality, BFSI, healthcare, retail and e-commerce, media and entertainment, and manufacturing, among others. The media and entertainment sector occupies a significant share of the market as under this sector large volume of content is produced such as movies, TV shows, news articles and streaming, among others, which necessitates the requirement of a monitoring tool that can effectively manage and analyse this content.
The market participants are harnessing the capabilities of AI and ML in these tools to meet the evolving regulatory landscape.


Upto 15% Off
USD
$2499 $2249
$3999 $3599
$4999 $4249
$5999 $5099


*While we strive to always give you current and accurate information, the numbers depicted on the website are indicative and may differ from the actual numbers in the main report. At Expert Market Research, we aim to bring you the latest insights and trends in the market. Using our analyses and forecasts, stakeholders can understand the market dynamics, navigate challenges, and capitalize on opportunities to make data-driven strategic decisions.*
Get in touch with us for a customized solution tailored to your unique requirements and save upto 35%!
The market is estimated to grow at a CAGR of 16.80% between 2026 and 2035.
The market is being driven due to rising usage of social media platforms, growing demand for competitive intelligence, and increased implementation of real-time media analytics.
The key trends aiding the market include the growth of startups and company branches, integration of AI and ML in these tools, and rising demand to handle potential crises.
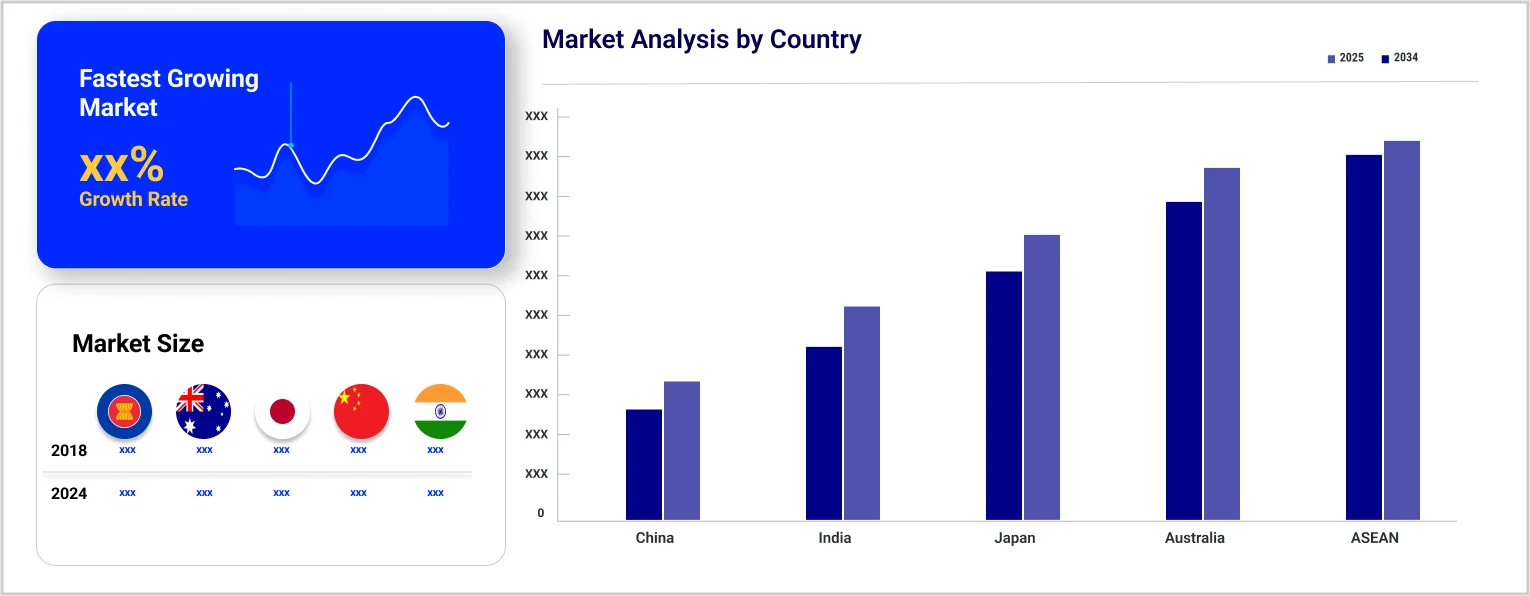
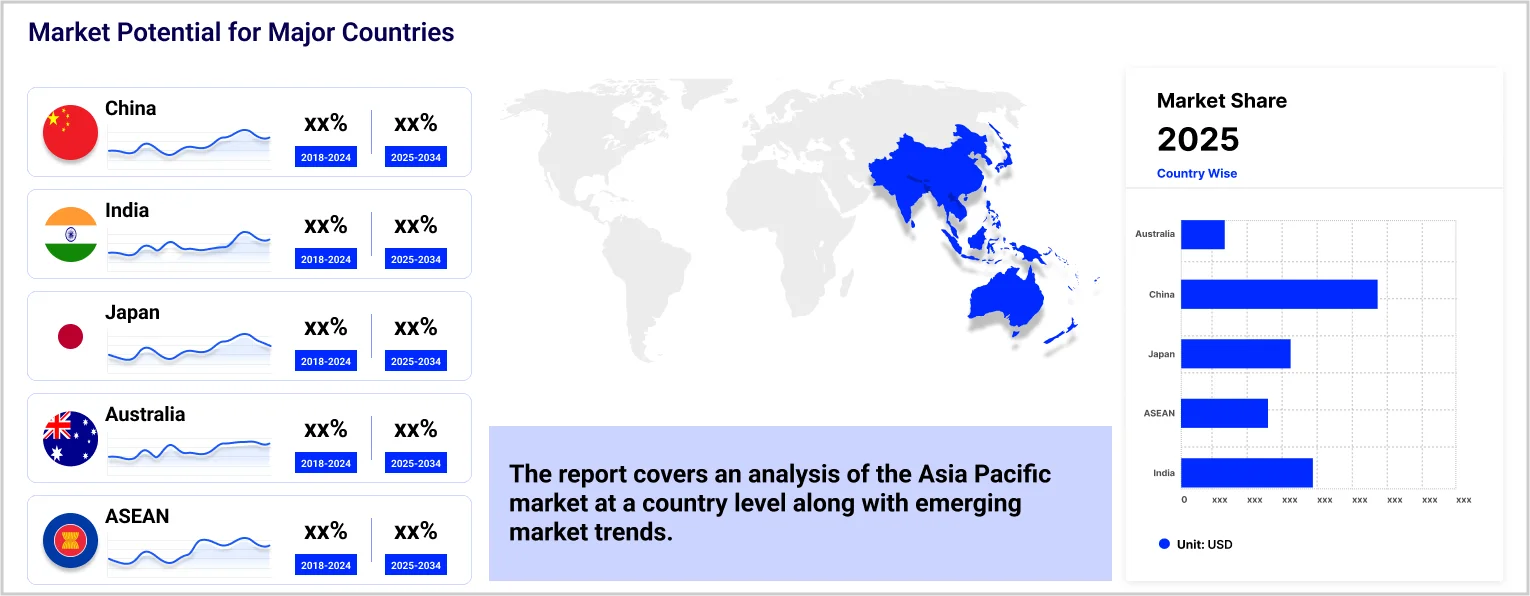
Countries considered in the market are China, Japan, India, ASEAN, and Australia, among others.
Based on component, market segmentations include software and services.
Different enterprise sizes are small and medium enterprises and large enterprises.
The media and entertainment sector holds the highest share of the market.
The major players in the market are Brandwatch, Meltwater NV, Synthesio Group, Hootsuite Inc., Talkwalker Inc., Cision Ltd.¸Streem Group of companies, Locobuzz, Determ d.o.o., and Isentia Group Pty Limited, among others.
In 2025, the market attained a value of nearly USD 1.76 Billion.
The market is estimated to witness a healthy growth in the forecast period of 2026-2035 to reach about USD 8.32 Billion by 2035.
Explore our key highlights of the report and gain a concise overview of key findings, trends, and actionable insights that will empower your strategic decisions.
| REPORT FEATURES | DETAILS |
| Base Year | 2025 |
| Historical Period | 2019-2025 |
| Forecast Period | 2026-2035 |
| Scope of the Report |
Historical and Forecast Trends, Industry Drivers and Constraints, Historical and Forecast Market Analysis by Segment:
|
| Breakup by Component |
|
| Breakup by Enterprise Size |
|
| Breakup by Industry Vertical |
|
| Breakup by Region |
|
| Market Dynamics |
|
| Competitive Landscape |
|
| Companies Covered |
|
Datasheet
One User
USD 2,499
USD 2,249
tax inclusive*
Single User License
One User
USD 3,999
USD 3,599
tax inclusive*
Five User License
Five User
USD 4,999
USD 4,249
tax inclusive*
Corporate License
Unlimited Users
USD 5,999
USD 5,099
tax inclusive*
*Please note that the prices mentioned below are starting prices for each bundle type. Kindly contact our team for further details.*
Flash Bundle
Small Business Bundle
Growth Bundle
Enterprise Bundle
*Please note that the prices mentioned below are starting prices for each bundle type. Kindly contact our team for further details.*
Flash Bundle
Number of Reports: 3
20%
tax inclusive*
Small Business Bundle
Number of Reports: 5
25%
tax inclusive*
Growth Bundle
Number of Reports: 8
30%
tax inclusive*
Enterprise Bundle
Number of Reports: 10
35%
tax inclusive*
How To Order

Select License Type
Choose the right license for your needs and access rights.

Click on ‘Buy Now’
Add the report to your cart with one click and proceed to register.

Select Mode of Payment
Choose a payment option for a secure checkout. You will be redirected accordingly.
Gain insights to stay ahead and seize opportunities.

Get insights & trends for a competitive edge.

Track prices with detailed trend reports.

Analyse trade data for supply chain insights.

Leverage cost reports for smart savings

Enhance supply chain with partnerships.

Connect For More Information
Our expert team of analysts will offer full support and resolve any queries regarding the report, before and after the purchase.
Our expert team of analysts will offer full support and resolve any queries regarding the report, before and after the purchase.
We employ meticulous research methods, blending advanced analytics and expert insights to deliver accurate, actionable industry intelligence, staying ahead of competitors.
Our skilled analysts offer unparalleled competitive advantage with detailed insights on current and emerging markets, ensuring your strategic edge.
We offer an in-depth yet simplified presentation of industry insights and analysis to meet your specific requirements effectively.


Share