

Consumer Insights
Uncover trends and behaviors shaping consumer choices today
Procurement Insights
Optimize your sourcing strategy with key market data
Industry Stats
Stay ahead with the latest trends and market analysis.

The Asia Pacific meal replacement market size reached around USD 4.15 Billion in 2025. The market is projected to grow at a CAGR of 8.30% between 2026 and 2035 to reach nearly USD 9.21 Billion by 2035. The market growth can be attributed to the growing purchasing power of Gen Z in countries like China, and the introduction of innovative meal replacement solutions in India and Singapore. Major companies are focusing on incorporating natural ingredients into their meal replacement items, which is further contributing to the market growth.
Base Year
Historical Period
Forecast Period
The increasing shift towards consumer preferences, especially among the young population, is driving the demand for healthy, convenient, and on-the-go food options, including meal replacement products. Hence, key players are diversifying their product offerings to expand their nutritional content, functional benefits, and flavour offerings. For instance, Bestore, a major snacks brand, launched 27 meal replacement products in China for consumers aged 18-35 years in August 2020.
There is a growing demand for protein-rich meal replacement items that facilitate weight loss amid the rising prevalence of obesity. Reportedly, 38% of Papua New Guinea’s population is expected to be obese by 2035. Over the forecast period, the demand for energy bars and protein shakes is expected to rise substantially, due to the growth of the packaged food industry. This is expected to complement the market growth in the coming years.
As per industry reports, the number of brands in China’s meal replacement industry grew by 2x during 2018-22, due to the rise of snacking culture and the shift towards portion control during mealtimes among consumers. In the coming years, the increasing purchasing power of the Gen Z population is expected to drive sales of meal replacement items.
Compound Annual Growth Rate
8.3%
Value in USD Billion
2026-2035
*this image is indicative*
|
Asia Pacific Meal Replacement Market Report Summary |
Description |
Value |
|
Base Year |
USD Billion |
2025 |
|
Historical Period |
USD Billion |
2019-2025 |
|
Forecast Period |
USD Billion |
2026-2035 |
|
Market Size 2025 |
USD Billion |
4.15 |
|
Market Size 2035 |
USD Billion |
9.21 |
|
CAGR 2019-2025 |
Percentage |
XX% |
|
CAGR 2026-2035 |
Percentage |
8.30% |
|
CAGR 2026-2035 - Market by Country |
India |
8.4% |
|
CAGR 2026-2035 - Market by Country |
China |
8.2% |
|
CAGR 2026-2035 - Market by Product |
Shakes |
8.8% |
|
CAGR 2026-2035 - Market by Distribution Channel |
Online Channels |
13.1% |
|
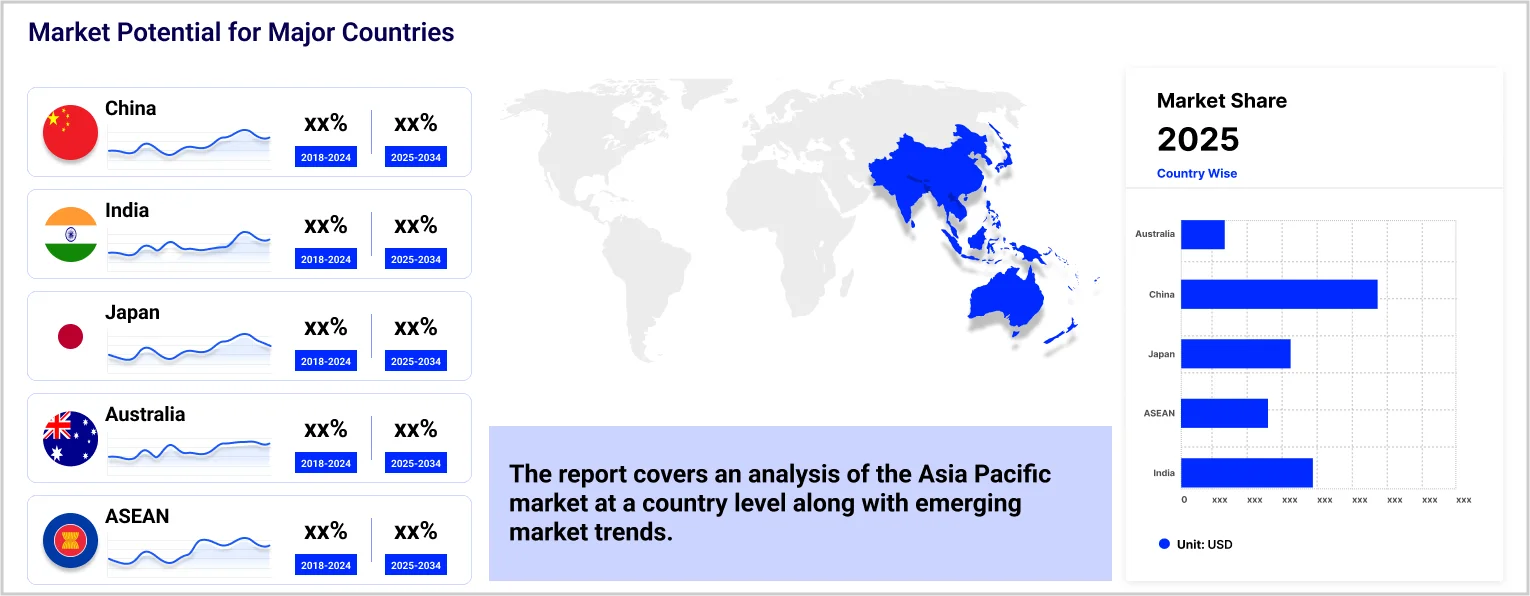
2025 Market Share by Country |
Australia |
6.1% |
By 2027, the demand for packaged food products in India is expected to reach nearly USD 3.4 billion due to the rapid increase in urban population and the emergence of D2C health and wellness brands. The shift towards convenience foods is underpinned by increasingly busy consumer lifestyles and the introduction of healthy meal replacement items. This is favourably impacting the Asia Pacific meal replacement market dynamics.
As per the World Obesity Atlas 2023, Papua New Guinea is expected to witness an annual obesity growth rate of 2.8% (in adults) and 5.2% (in children). In the Western Pacific region, obesity among men is expected to increase to 19% of the population, while among Southeast Asian women, it can potentially increase to 16% by the end of 2025. This is expected to increase the demand for meal replacement items, which are kilojoule-controlled food products designed to facilitate rapid weight loss while conserving lean body mass. By 2035, two-thirds of the adult population of island countries like Tonga, Samoa, and Kiribati are expected to be obese, thereby driving the Asia Pacific meal replacement market expansion.
Rising focus on low-carb and sugar-free items; growing demand for meal replacement products from Gen Z in China; increasing appeal for localised flavours; and surging focus on highly nutritious foods are the major factors driving the Asia Pacific meal replacement market growth.
There is a rising demand for low-carb-and-sugar diet as it enables consumers to lose weight rapidly and prevent early signs of ageing. Besides, the rapidly growing population in the region is driving the demand for healthy and nutritious energy bars and protein shakes that boost collagen production while facilitating the maintenance of energy levels in the body throughout the day.
In 2020, increasing health consciousness among Gen Z consumers led to a 50% increase in overall sales of meal replacement products in China. The increasing purchasing power of Gen Z and their inclination to stick to specific brands makes them an attractive consumer segment for key market players.
While meal replacement shakes are dominating the market in many countries, the demand for different flavours such as matcha, red bean, and milk tea is increasing rapidly. This is favourably shaping the Asia Pacific meal replacement market dynamics.
Protein bars and chicken breasts have become extremely popular among consumers in the Asia Pacific region, especially in Tier I cities. This can be attributed to the rapid growth of consumer disposable incomes, increasingly busy lifestyles, and the burgeoning demand for delicious and nutritious meal replacement solutions.

Increasing appeal for localised flavours
In the Asia Pacific, the increasing demand for shakes is being complemented by flavour innovations which cater to the consumers’ local preferences and tastes. Major market players are enhancing the appeal of their meal replacement products by incorporating unique flavours like matcha and red bean into their product offerings. Companies which make substantial investments in diversifying their product offerings are expected to constitute a major portion of the Asia Pacific meal replacement market share. Consumers seeking culturally relevant options are expected to benefit from this market trend substantially.
Rising demand from Gen Z in China
In 2020, the number of Chinese consumers purchasing meal replacement products surged by 50%, mainly in Tier I and Tier II cities. Products featuring ingredients like oats, white kidney beans, red dates, and marine collagen peptides have become significantly popular among consumers. As per the Asia Pacific meal replacement market analysis, consumers aged below 25 years form the largest consumer section for meal replacement products, especially women who exhibit a higher preference for trying weight loss products.
The EMR’s report titled “Asia Pacific Meal Replacement Market Report and Forecast 2026-2035” offers a detailed analysis of the market based on the following segments:
Breakup by Product
Breakup by Purpose
Breakup by Flavour
Breakup by Distribution Channel
Breakup by Country
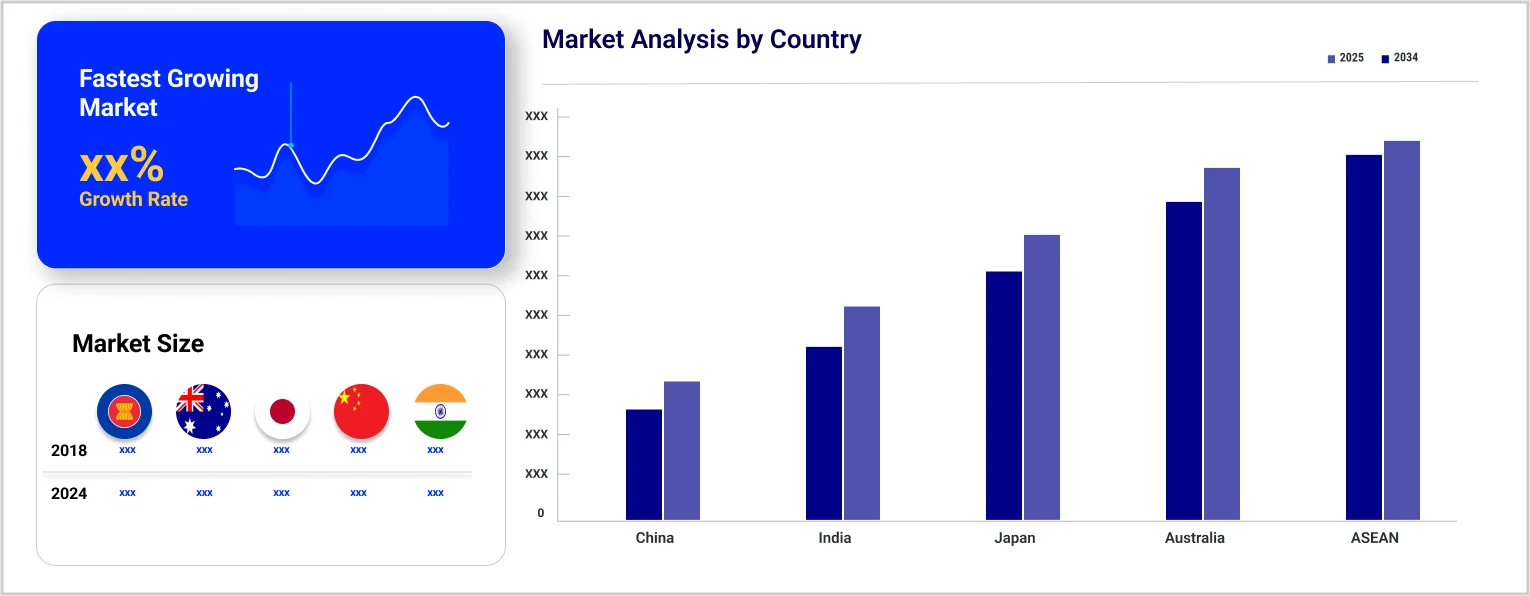
Based on country, the market is segmented into China, Japan, India, ASEAN, and Australia, among others. Over the forecast period of 2026-2035, the market in India and China are expected to grow at a CAGR of 8.4% and 8.2%, respectively. This can be attributed to the increasing use of natural ingredients in meal replacement products, which is enhancing their appeal among consumers. Moreover, rapid urbanisation and rising income levels are also favourably shaping the market dynamics.
Based on product, the market is categorised into shakes and soups, among others. The Asia Pacific meal replacement market forecast suggests that the market for meal replacement shakes is expected to increase at a rate of 8.8% between 2026 and 2035 due to the introduction of novel flavours that appeal to the Gen Z population.
|
CAGR 2026-2035 - Market by |
Product |
|
Shakes |
8.8% |
|
Soups |
XX% |
|
Others |
XX% |
Major Asia Pacific meal replacement market players are developing consumer-centric strategies for driving growth. For instance, the development of personalised nutrition plans and the introduction of unique products in different flavours are increasing the market revenue. By growing their omnichannel presence and investing in new formulation development, leading companies are expected to attain a significant portion of the market share in upcoming years.
PharmaCare Laboratories Pty Ltd. was founded in 1985 and is headquartered in New South Wales, Australia. It is a renowned health and wellness company that exports its products to over 40 countries in North America, Asia, and Europe. Its most popular brands are Sambucol, Bioglan, Medi+, KP24, Brut, and Norsca, among others.
BellRing Brands, Inc. was founded in 2019 and is headquartered in Missouri, United States. It is engaged in manufacturing convenient protein solutions, including protein powders and shakes, and exports its products to over 70 countries worldwide.
Herbalife Nutrition Ltd. was founded in 1980 and is headquartered in California, United States. It is a renowned health and wellness company present in over 90 countries worldwide. It specialises in the production of meal replacement products.
Amway Corporation was founded in 1959 and is headquartered in Michigan, United States. It specialises in producing and distributing home care products, and health and wellness solutions in over 100 countries worldwide.
*Please note that this is only a partial list; the complete list of key players is available in the full report. Additionally, the list of key players can be customized to better suit your needs.*
Other players included in the Asia Pacific meal replacement market report are THG Nutrition Limited., Glanbia plc, Bright Lifecare Private Limited, Scitron Nutrition PVT LTD., Ultimate Nutrition Inc., and Muscle Nation, among others.


Upto 15% Off
USD
$2499 $2249
$3999 $3599
$4999 $4249
$5999 $5099


*While we strive to always give you current and accurate information, the numbers depicted on the website are indicative and may differ from the actual numbers in the main report. At Expert Market Research, we aim to bring you the latest insights and trends in the market. Using our analyses and forecasts, stakeholders can understand the market dynamics, navigate challenges, and capitalize on opportunities to make data-driven strategic decisions.*
Get in touch with us for a customized solution tailored to your unique requirements and save upto 35%!
In 2025, the market reached an approximate value of USD 4.15 Billion.
The market is projected to grow at a CAGR of 8.30% between 2026 and 2035.
The market is estimated to witness healthy growth in the forecast period of 2026-2035 to reach a value of around USD 9.21 Billion by 2035.
The different countries considered in the market report include China, Japan, India, ASEAN, and Australia, among others.
The different meal replacement products available in the market are soups and shakes, among others.
Consumers purchase meal replacement products for body building or slimming.
The different distribution channels for meal replacement products are hypermarkets/supermarkets, convenience stores, speciality stores, and online channels, among others.
Key players in the market are PharmaCare Laboratories Pty Ltd., BellRing Brands, Inc., THG Nutrition Limited., Glanbia plc, Herbalife Nutrition Ltd., Bright Lifecare Private Limited, Scitron Nutrition PVT LTD., Ultimate Nutrition Inc., Muscle Nation, and Amway Corporation, among others.
Explore our key highlights of the report and gain a concise overview of key findings, trends, and actionable insights that will empower your strategic decisions.
| REPORT FEATURES | DETAILS |
| Base Year | 2025 |
| Historical Period | 2019-2025 |
| Forecast Period | 2026-2035 |
| Scope of the Report |
Historical and Forecast Trends, Industry Drivers and Constraints, Historical and Forecast Market Analysis by Segment:
|
| Breakup by Product |
|
| Breakup by Purpose |
|
| Breakup by Flavour |
|
| Breakup by Distribution Channel |
|
| Breakup by Region |
|
| Market Dynamics |
|
| Competitive Landscape |
|
| Companies Covered |
|
Datasheet
One User
USD 2,499
USD 2,249
tax inclusive*
Single User License
One User
USD 3,999
USD 3,599
tax inclusive*
Five User License
Five User
USD 4,999
USD 4,249
tax inclusive*
Corporate License
Unlimited Users
USD 5,999
USD 5,099
tax inclusive*
*Please note that the prices mentioned below are starting prices for each bundle type. Kindly contact our team for further details.*
Flash Bundle
Small Business Bundle
Growth Bundle
Enterprise Bundle
*Please note that the prices mentioned below are starting prices for each bundle type. Kindly contact our team for further details.*
Flash Bundle
Number of Reports: 3
20%
tax inclusive*
Small Business Bundle
Number of Reports: 5
25%
tax inclusive*
Growth Bundle
Number of Reports: 8
30%
tax inclusive*
Enterprise Bundle
Number of Reports: 10
35%
tax inclusive*
How To Order

Select License Type
Choose the right license for your needs and access rights.

Click on ‘Buy Now’
Add the report to your cart with one click and proceed to register.

Select Mode of Payment
Choose a payment option for a secure checkout. You will be redirected accordingly.
Gain insights to stay ahead and seize opportunities.

Get insights & trends for a competitive edge.

Track prices with detailed trend reports.

Analyse trade data for supply chain insights.

Leverage cost reports for smart savings

Enhance supply chain with partnerships.

Connect For More Information
Our expert team of analysts will offer full support and resolve any queries regarding the report, before and after the purchase.
Our expert team of analysts will offer full support and resolve any queries regarding the report, before and after the purchase.
We employ meticulous research methods, blending advanced analytics and expert insights to deliver accurate, actionable industry intelligence, staying ahead of competitors.
Our skilled analysts offer unparalleled competitive advantage with detailed insights on current and emerging markets, ensuring your strategic edge.
We offer an in-depth yet simplified presentation of industry insights and analysis to meet your specific requirements effectively.


Share