

Consumer Insights
Uncover trends and behaviors shaping consumer choices today
Procurement Insights
Optimize your sourcing strategy with key market data
Industry Stats
Stay ahead with the latest trends and market analysis.

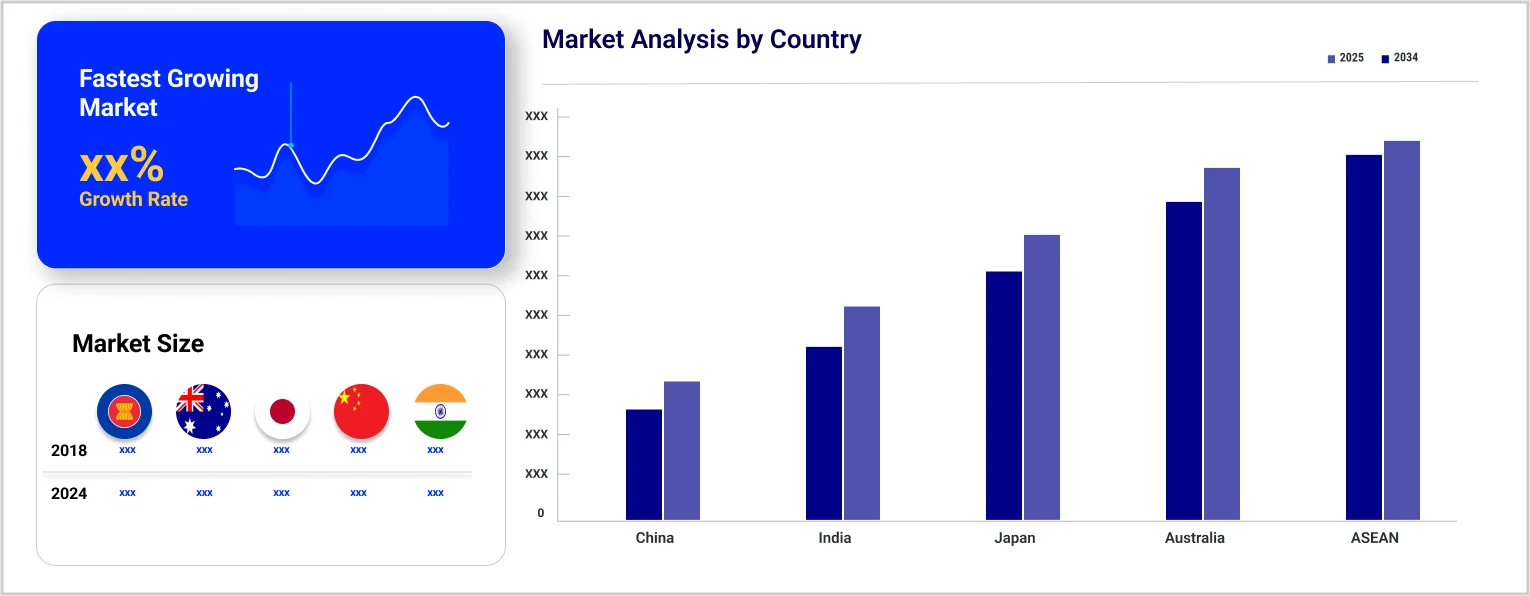
The Asia Pacific loyalty management market was valued at USD 3.86 Billion in 2025. The industry is expected to grow at a CAGR of 24.20% during the forecast period of 2026-2035 to attain a valuation of USD 33.71 Billion by 2035.
Base Year
Historical Period
Forecast Period
It is estimated that by 2030, South Asia will add 40% of the newly minted middle-class consumers, moreover, 1 billion new entrants to the consumer class will be added by 2030.
Asia is home to a significant number of internet users, holding a share of 57.9%.
The Philippines, Indonesia, Thailand, and Malaysia are among the top ten regions in terms of social media use, globally.
Compound Annual Growth Rate
24.2%
Value in USD Billion
2026-2035
*this image is indicative*
Loyalty programs in the region are undergoing significant changes as retailers, banks and telcos adjust to the shifting landscape of loyalty. The growing digital landscape in Asian countries is leading to the growth of mobile loyalty applications and value redemption rates. By integrating advanced analytics, artificial intelligence, and innovative loyalty platforms, businesses can target a diverse consumer base with personalised offerings.
Reportedly, grocery sales are anticipated to increase by 6-7% through 2025, particularly in Southeast Asia, where USD 200 billion is being spent annually on groceries. Consumers in the region are responding to rising prices by lowering travel expenditures, adopting online shopping and taking advantage of discounts and special offers. With increasing competition, retailers are engaging in strategic approaches and innovating their loyalty programs to attract and retain customers in the thriving market.
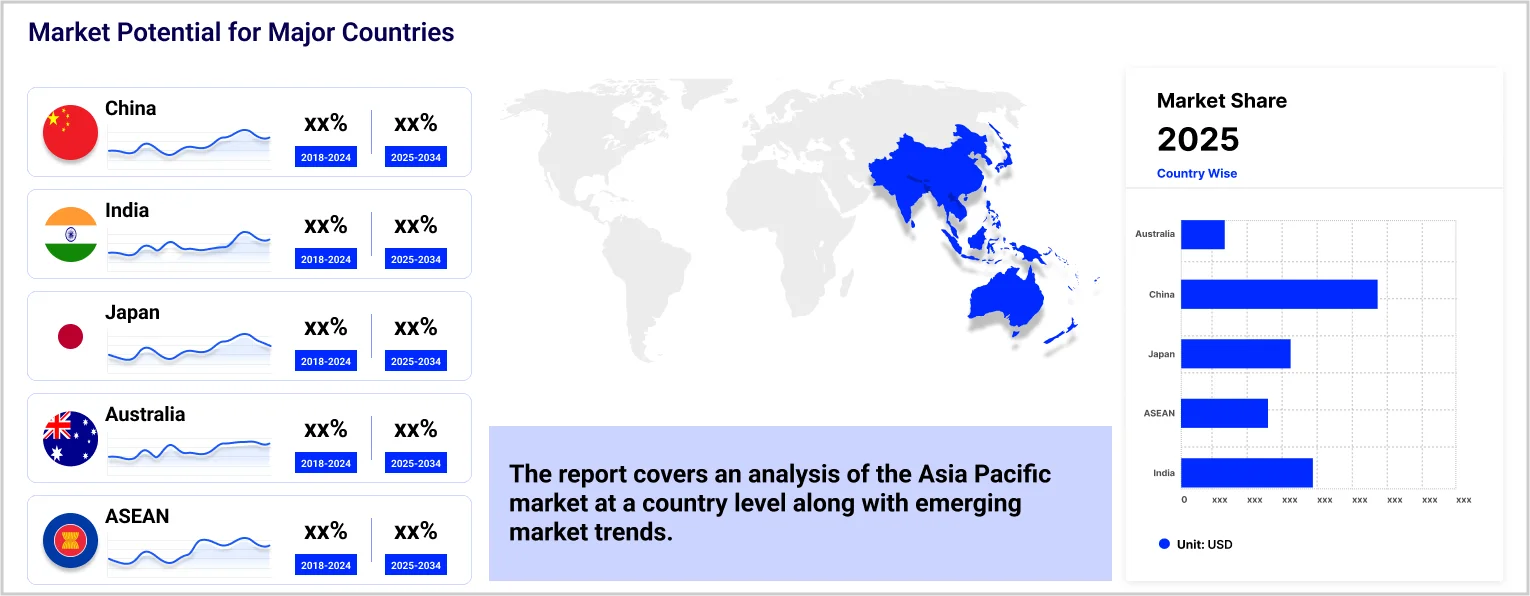
In emerging countries such as mainland China, Vietnam, Thailand, Indonesia, the Philippines, and India, there is an increasing opportunity to capitalize on the demand for loyalty programs among the growing middle classes. Loyalty programs can serve as a means for organisations to move away from the conventional and simplistic approach of offering heavy discounts. In India and Indonesia, consumers are members of around 10-11 loyalty programs, on average, while consumers in developed markets, such as Australia and Japan, are members of around 6 programs and 4 programs, respectively.
Asia Pacific Loyalty Management Market Report and Forecast 2026-2035 offers a detailed analysis of the market based on the following segments:
Market Breakup by Component
Market Breakup by Deployment
Market Breakup by Operator
Market Breakup by Organisation Size
Market Breakup by End-Use
Market Breakup by Country

Based on end use, the market is divided into BFSI, automotive, aviation, retail and customer goods, hospitality, media and entertainment, among others. The retail sector is witnessing significant growth with the rapid expansion of e-commerce, development of robust logistics and supply chain infrastructure, and advanced technological capabilities.
The report provides a detailed analysis of the following key players in the market, covering their competitive landscape and latest developments like mergers and acquisitions, investments, and product launches.
The market participants are integrating technologies such as blockchain for marketing campaigns using smart contracts and reward programs to gain competitive edge in the market.


Upto 15% Off
USD
$2499 $2249
$3999 $3599
$4999 $4249
$5999 $5099


*While we strive to always give you current and accurate information, the numbers depicted on the website are indicative and may differ from the actual numbers in the main report. At Expert Market Research, we aim to bring you the latest insights and trends in the market. Using our analyses and forecasts, stakeholders can understand the market dynamics, navigate challenges, and capitalize on opportunities to make data-driven strategic decisions.*
Get in touch with us for a customized solution tailored to your unique requirements and save upto 35%!
The market is estimated to grow at a CAGR of 24.20% between 2026 and 2035.
The major countries include Malaysia, Thailand, Indonesia, The Philippines, Vietnam, Singapore, Australia, Japan, China, India, and others.
The two kinds of operators are B2B and B2C.
The different kinds of services are professional services, and managed services.
Channel loyalty, customer loyalty, and customer retention are the three types of solutions mentioned in the market report.
The major classifications based on organisation size include large organization, and small and mid-size organization.
The major end uses include BFSI, automotive, aviation, retail and customer goods, media and entertainment, hospitality, and others.
The major players in the market are Benefit One Inc, GMS Group Pte Ltd., Asia Top Loyalty Limited, Edenred Group, COMARCH SA, Oracle Corporation, IBM Corporation, SAP SE, and Bond Brand Loyalty, among others.
In 2025, the market attained a value of nearly USD 3.86 Billion.
The market is estimated to witness a healthy growth in the forecast period of 2026-2035 to reach about USD 33.71 Billion by 2035.
Explore our key highlights of the report and gain a concise overview of key findings, trends, and actionable insights that will empower your strategic decisions.
| REPORT FEATURES | DETAILS |
| Base Year | 2025 |
| Historical Period | 2019-2025 |
| Forecast Period | 2026-2035 |
| Scope of the Report |
Historical and Forecast Trends, Industry Drivers and Constraints, Historical and Forecast Market Analysis by Segment:
|
| Breakup by Component |
|
| Breakup by Deployment |
|
| Breakup by Operator |
|
| Breakup by Organisation Size |
|
| Breakup by End-Use |
|
| Breakup by Region |
|
| Market Dynamics |
|
| Competitive Landscape |
|
| Companies Covered |
|
Datasheet
One User
USD 2,499
USD 2,249
tax inclusive*
Single User License
One User
USD 3,999
USD 3,599
tax inclusive*
Five User License
Five User
USD 4,999
USD 4,249
tax inclusive*
Corporate License
Unlimited Users
USD 5,999
USD 5,099
tax inclusive*
*Please note that the prices mentioned below are starting prices for each bundle type. Kindly contact our team for further details.*
Flash Bundle
Small Business Bundle
Growth Bundle
Enterprise Bundle
*Please note that the prices mentioned below are starting prices for each bundle type. Kindly contact our team for further details.*
Flash Bundle
Number of Reports: 3
20%
tax inclusive*
Small Business Bundle
Number of Reports: 5
25%
tax inclusive*
Growth Bundle
Number of Reports: 8
30%
tax inclusive*
Enterprise Bundle
Number of Reports: 10
35%
tax inclusive*
How To Order

Select License Type
Choose the right license for your needs and access rights.

Click on ‘Buy Now’
Add the report to your cart with one click and proceed to register.

Select Mode of Payment
Choose a payment option for a secure checkout. You will be redirected accordingly.
Gain insights to stay ahead and seize opportunities.

Get insights & trends for a competitive edge.

Track prices with detailed trend reports.

Analyse trade data for supply chain insights.

Leverage cost reports for smart savings

Enhance supply chain with partnerships.

Connect For More Information
Our expert team of analysts will offer full support and resolve any queries regarding the report, before and after the purchase.
Our expert team of analysts will offer full support and resolve any queries regarding the report, before and after the purchase.
We employ meticulous research methods, blending advanced analytics and expert insights to deliver accurate, actionable industry intelligence, staying ahead of competitors.
Our skilled analysts offer unparalleled competitive advantage with detailed insights on current and emerging markets, ensuring your strategic edge.
We offer an in-depth yet simplified presentation of industry insights and analysis to meet your specific requirements effectively.


Share