

Consumer Insights
Uncover trends and behaviors shaping consumer choices today
Procurement Insights
Optimize your sourcing strategy with key market data
Industry Stats
Stay ahead with the latest trends and market analysis.

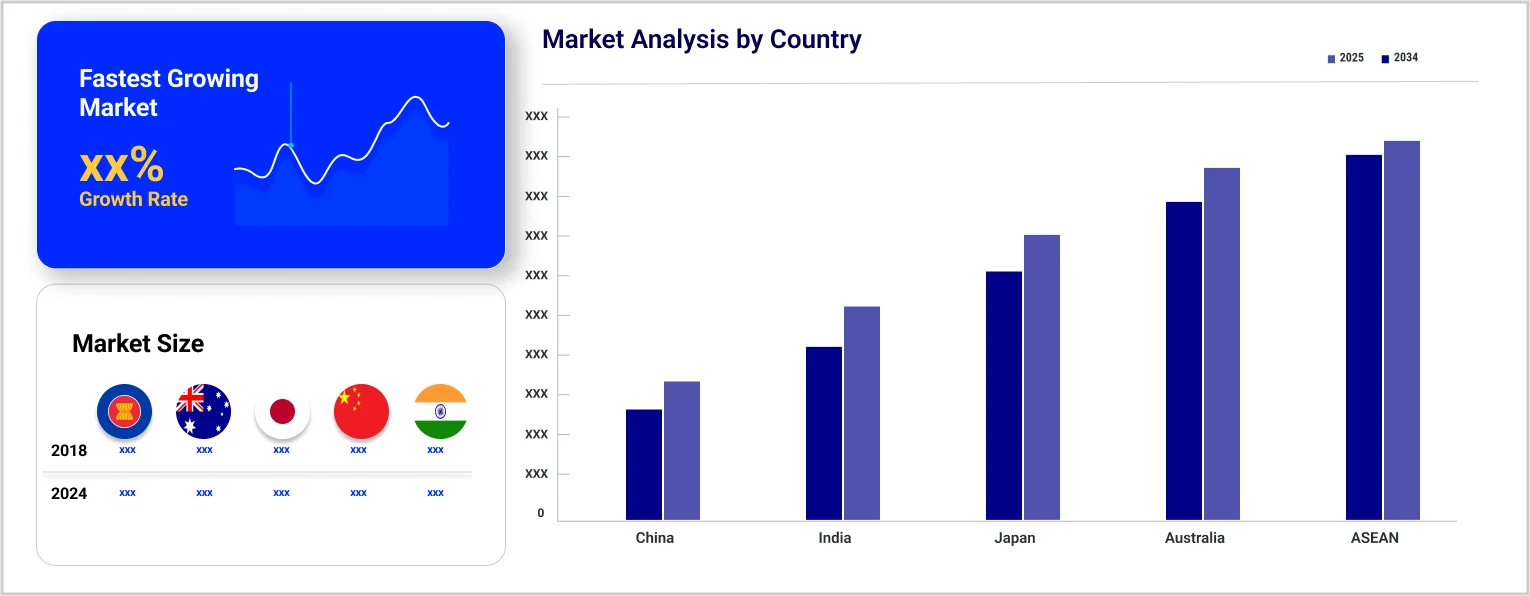
The Asia Pacific gaming console market was valued at USD 15.77 Billion in 2025. The industry is expected to grow at a CAGR of 7.80% during the forecast period of 2026-2035 to attain a valuation of USD 33.42 Billion by 2035.
Base Year
Historical Period
Forecast Period
In 2021, PS5 sold around 60,000 units in India, establishing it as the bestselling gaming console that year.
The Asia region has around 1.5 billion gamers, which provides ample opportunities for the demand for gaming consoles.
As per the industry reports, Nintendo and PlayStation are China's most prominent gaming consoles.
Compound Annual Growth Rate
7.8%
Value in USD Billion
2026-2035
*this image is indicative*
The availability of exclusive game titles on consoles, the rapid rise of gamers in the region, and the increased purchasing power of the customers are some of the major market drivers. Some of the exclusive game titles include The Last of Us, Final Fantasy, and Bloodborne, among others.
Further, according to Asia Pacific gaming console industry analysis, there is also a surge in the popularity of subscription services such as PlayStation Now and Xbox Game Pass which offers access to a vast collection of games, including those available in the previous generation of consoles. It further offers a large number of downloadable games, which removes the issue of slow game streaming due to bad internet connection. These services can also add new game titles every month, offering the players something new to try on occasionally.
Moreover, market players are consistently launching new generations of consoles with enhanced functionalities such as superior video quality. For instance, Nintendo is all set to launch Switch 2 with an all-new range of games as well as better visual output.

Preference for online video games, rising e-commerce sales, technological advancements, and frequent launches of exclusive game titles are accelerating the Asia Pacific gaming console market value.
The growing preference for online multiplayer and live-service games owing to the increased use of smart devices and internet penetration is propelling the gaming console demand. According to the World Bank, 76% of the total population in the region used the Internet in 2022. As this share grows in the coming years, the demand for gaming consoles is expected to rise further.
E-commerce platforms are witnessing increased sales of gaming consoles in Asia Pacific, thereby raising the overall market revenue. According to the projections of the International Trade Administration, e-commerce business in the electronic goods segment which includes gaming consoles, will reach USD 868 billion in 2027 from an estimated value of USD 582 billion in 2024. This indicates a growing demand for consoles and their preferred purchase from e-commerce sites in the coming years.
Advancements in gaming technology, such as augmented reality (AR), virtual reality (VR), and cloud gaming, are transforming the console gaming experience. With the release of next-gen consoles like the PlayStation 5 and Xbox Series X, which support higher graphics resolutions, faster load times, and features like ray tracing, the demand for high-end consoles is expected to witness a sharp surge.
Console manufacturers like Sony, Microsoft, and Nintendo often release exclusive titles that can only be played on their respective platforms, such as The Legend of Zelda, Final Fantasy XVI, and Spider-Man: Miles Morales. These exclusive games encourage gamers to purchase specific consoles to access them, increasing their overall consumption in Asia Pacific.
“Asia Pacific Gaming Console Market Report and Forecast 2026-2035” offers a detailed analysis of the market based on the following segments:
Market Breakup by Type
Market Breakup by Platform
Market Breakup by End Use
Market Breakup by Distribution Channel
Market Breakup by Country
Based on the platform, the market is divided into PlayStation, Xbox, and Wii, among others. PlayStation occupies a significant share of the market due to the burgeoning popularity of the PlayStation Now streaming service which contains game titles from PS2, PS3, and PS4 generations. Furthermore, this console is also equipped with game titles such as Uncharted series, Spider-Man, and The Last of Us which has held the interest of a large number of Asian customers over the recent years.
The market players are readily launching new generation consoles with superior design and features to gain a competitive edge in the market.


Upto 15% Off
USD
$2499 $2249
$3999 $3599
$4999 $4249
$5999 $5099


*While we strive to always give you current and accurate information, the numbers depicted on the website are indicative and may differ from the actual numbers in the main report. At Expert Market Research, we aim to bring you the latest insights and trends in the market. Using our analyses and forecasts, stakeholders can understand the market dynamics, navigate challenges, and capitalize on opportunities to make data-driven strategic decisions.*
Get in touch with us for a customized solution tailored to your unique requirements and save upto 35%!
The market is estimated to grow at a CAGR of 7.80% between 2026 and 2035.
The market is being driven due to availability of exclusive game titles on consoles, the rapid rise of gamers in the region, and the increased purchasing power of the customers.
The key trends aiding the market include the popularity of subscription services, the launch of new-gen consoles, and the integration of high-end technologies with these systems.
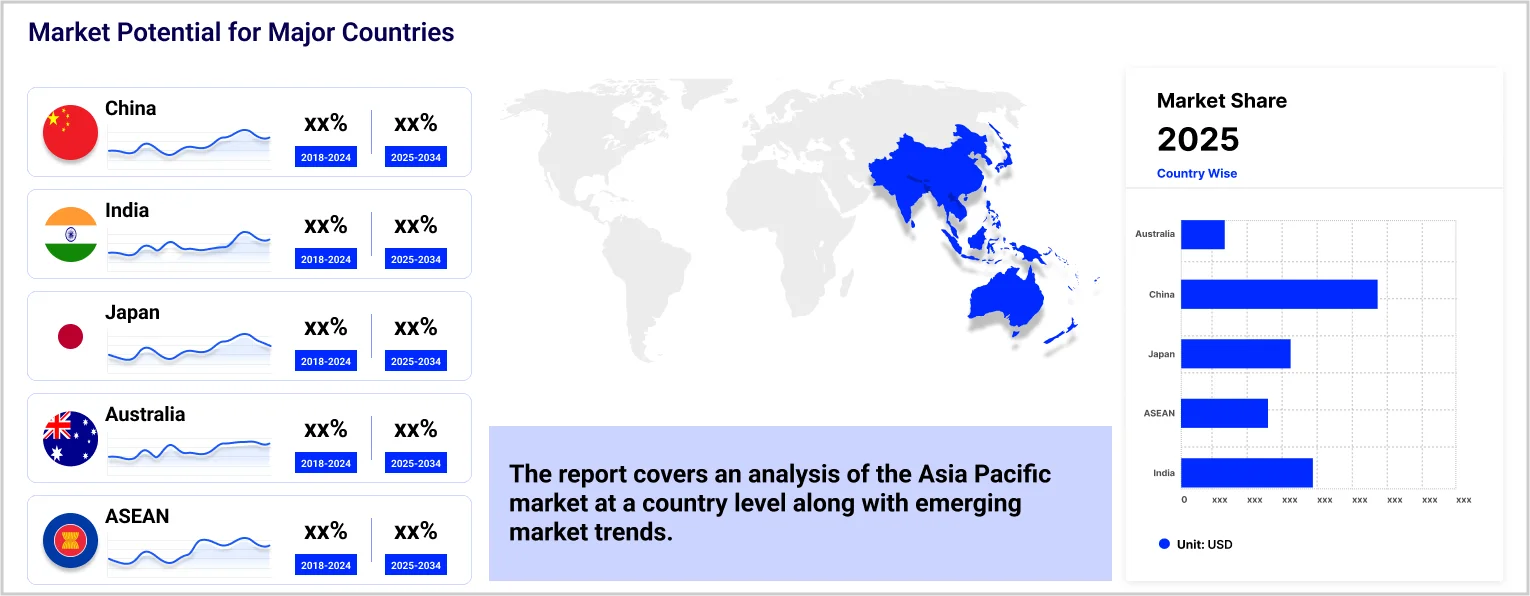
Countries considered in the market are China, Japan, India, ASEAN, and Australia, among others.
Based on platform, market segmentations include PlayStation, Xbox, and Wii, among others.
Various end uses are personal and commercial.
Nintendo and PlayStation are the most popular gaming consoles in China.
The major players in the market are Sony Corporation, Microsoft Corporation, Nintendo Co., Ltd., Logitech International SA, Atari Inc., Meta Platforms Technologies, Inc., Samsung Electronics Co. Ltd., Valve Corporation, HTC Corporation, and ASUSTEK Computer Inc., among others.
In 2025, the market attained a value of nearly USD 15.77 Billion.
The market is estimated to witness a healthy growth in the forecast period of 2026-2035 to reach about USD 33.42 Billion by 2035.
Explore our key highlights of the report and gain a concise overview of key findings, trends, and actionable insights that will empower your strategic decisions.
| REPORT FEATURES | DETAILS |
| Base Year | 2025 |
| Historical Period | 2019-2025 |
| Forecast Period | 2026-2035 |
| Scope of the Report |
Historical and Forecast Trends, Industry Drivers and Constraints, Historical and Forecast Market Analysis by Segment:
|
| Breakup by Type |
|
| Breakup by Platform |
|
| Breakup by End Use |
|
| Breakup by Distribution Channel |
|
| Breakup by Region |
|
| Market Dynamics |
|
| Competitive Landscape |
|
| Companies Covered |
|
Datasheet
One User
USD 2,499
USD 2,249
tax inclusive*
Single User License
One User
USD 3,999
USD 3,599
tax inclusive*
Five User License
Five User
USD 4,999
USD 4,249
tax inclusive*
Corporate License
Unlimited Users
USD 5,999
USD 5,099
tax inclusive*
*Please note that the prices mentioned below are starting prices for each bundle type. Kindly contact our team for further details.*
Flash Bundle
Small Business Bundle
Growth Bundle
Enterprise Bundle
*Please note that the prices mentioned below are starting prices for each bundle type. Kindly contact our team for further details.*
Flash Bundle
Number of Reports: 3
20%
tax inclusive*
Small Business Bundle
Number of Reports: 5
25%
tax inclusive*
Growth Bundle
Number of Reports: 8
30%
tax inclusive*
Enterprise Bundle
Number of Reports: 10
35%
tax inclusive*
How To Order

Select License Type
Choose the right license for your needs and access rights.

Click on ‘Buy Now’
Add the report to your cart with one click and proceed to register.

Select Mode of Payment
Choose a payment option for a secure checkout. You will be redirected accordingly.
Gain insights to stay ahead and seize opportunities.

Get insights & trends for a competitive edge.

Track prices with detailed trend reports.

Analyse trade data for supply chain insights.

Leverage cost reports for smart savings

Enhance supply chain with partnerships.

Connect For More Information
Our expert team of analysts will offer full support and resolve any queries regarding the report, before and after the purchase.
Our expert team of analysts will offer full support and resolve any queries regarding the report, before and after the purchase.
We employ meticulous research methods, blending advanced analytics and expert insights to deliver accurate, actionable industry intelligence, staying ahead of competitors.
Our skilled analysts offer unparalleled competitive advantage with detailed insights on current and emerging markets, ensuring your strategic edge.
We offer an in-depth yet simplified presentation of industry insights and analysis to meet your specific requirements effectively.


Share