

Consumer Insights
Uncover trends and behaviors shaping consumer choices today
Procurement Insights
Optimize your sourcing strategy with key market data
Industry Stats
Stay ahead with the latest trends and market analysis.
Trending Now


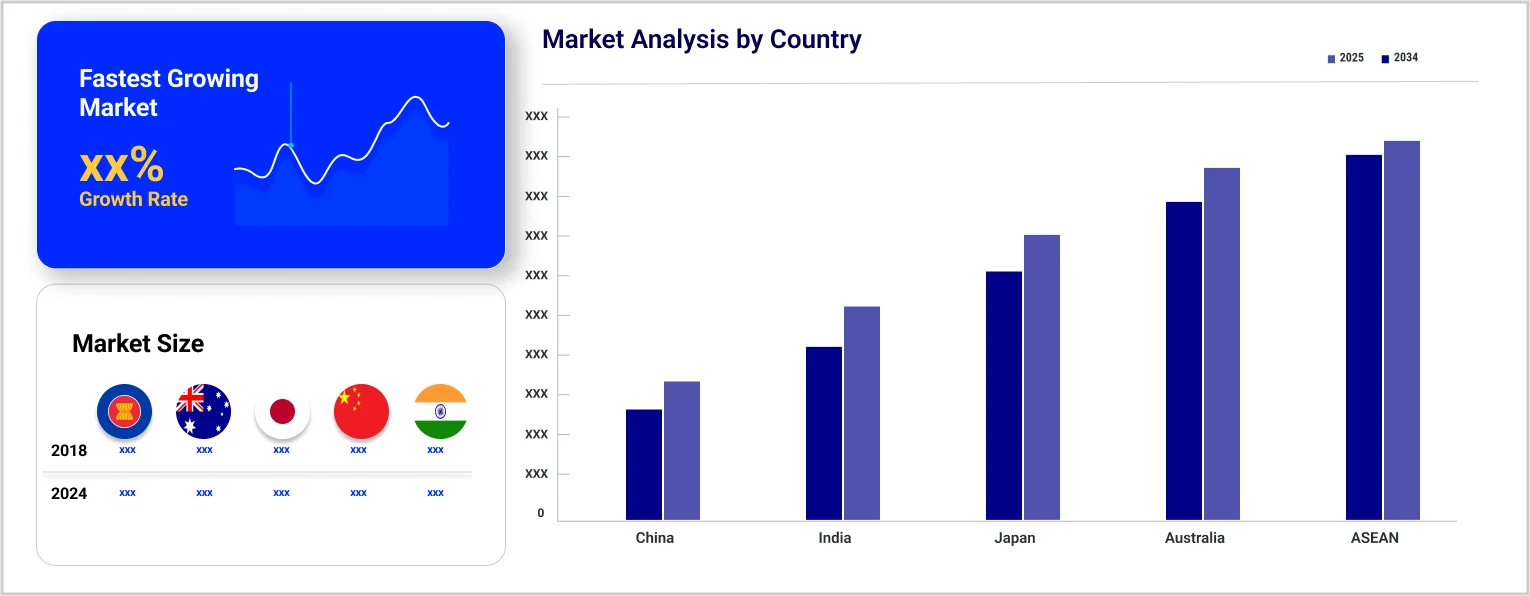
The Asia Pacific food service market reached USD 406.30 Billion in 2024. The market is projected to grow at a CAGR of 15.70% between 2025 and 2034, reaching almost USD 1746.55 Billion by 2034.
Base Year
Historical Year
Forecast Year
In March 2023, food service sales in Japan surged by 18.8% y-o-y.
Fast food restaurant chains are expected to remain popular outlets among the Gen Z population.
Organised food service sector in India presents an opportunity worth USD $33 billion for companies.


Value in USD Billion
2025-2034
Asia Pacific Food Service Market Outlook
*this image is indicative*
| Asia Pacific Food Service Market Report Summary | Description | Value |
| Base Year | USD Billion | 2024 |
| Historical Period | USD Billion | 2018-2024 |
| Forecast Period | USD Billion | 2025-2034 |
| Market Size 2024 | USD Billion | 406.30 |
| Market Size 2034 | USD Billion | 1746.55 |
| CAGR 2018-2024 | Percentage | XX% |
| CAGR 2025-2034 | Percentage | 15.70% |
| CAGR 2025-2034 - Market by Country | China | 20.3% |
| CAGR 2025-2034 - Market by Restaurants | Fast Food Restaurants | 17.9% |
| CAGR 2025-2034 - Market by Systems | Centralised Foodservice System | 17.3% |
| Market Share by Country 2024 | Japan | XX% |
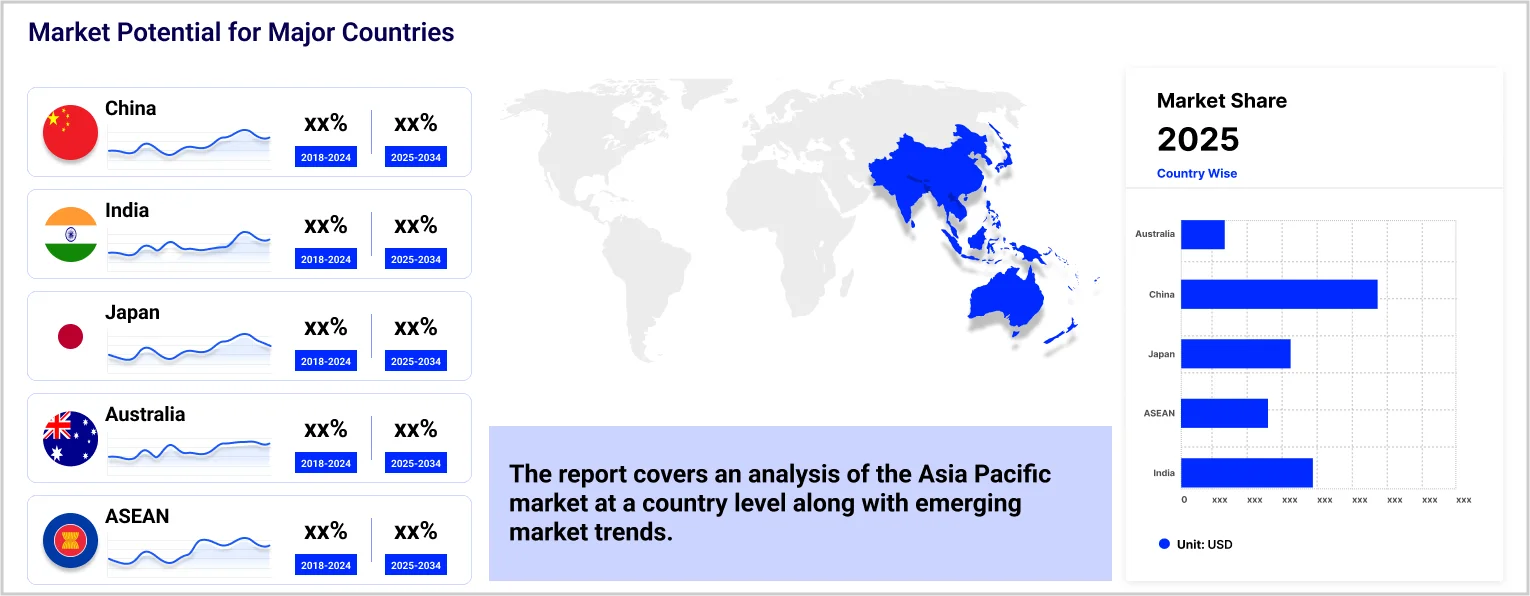
China is home to one of the world’s leading food service markets and is projected to grow at a CAGR of 20.3% during the forecast period of 2025-2034, This is being driven by the increasing demand for Latin American cuisines and the rising preference for innovative culinary experiences.
Meanwhile, the market in India is estimated to grow at a CAGR of 17.3% between 2025 and 2034. Between 2020 and 2022, annual spending by Indian middle-class households on fast food restaurants recorded a growth of 108% in India, reaching 5,400 rupees from 2,500 rupees.
The organised sector of the India market for foodservice constitutes over 45% of the domestic market share, with quick service restaurants and casual diners constituting a 70% share, due to their huge popularity among consumers. An increase in dine-out frequency is a key market driver, coupled with the rise of small independent restaurants which provide diverse food options with an exciting combination of ingredients and flavours. Enhanced accessibility to retail space is enabling commercial food companies to introduce innovative food offerings in distinct formats, thereby contributing to the market growth.
The increasing proportion of elderly people in countries like Japan, China, and South Korea, among others, is expected to prompt restaurants to incorporate senior citizen-friendly food items in their menus, which have low sodium content, are nutrient-rich, and can be easily digested. Moreover, the influx of consumers at drinking establishments and pubs has surged significantly, which is creating a bright market outlook.

Asia Pacific Food Service Market Report and Forecast 2025-2034 offers a detailed analysis of the market based on the following segments:
Market Breakup by Sector
Market Breakup by Systems
Market Breakup by Restaurants
Market Breakup by Country
| CAGR 2025-2034 - Market by | Systems |
| Centralised Foodservice System | 17.3% |
| Conventional Foodservice System | XX% |
| Ready Prepared Foodservice System | XX% |
| Assembly-Serve Foodservice System | XX% |
| CAGR 2025-2034 - Market by | Restaurants |
| Fast Food Restaurants | 17.9% |
| Full-Service Restaurants | XX% |
| Limited-Service Restaurants | XX% |
| Special Food Services Restaurants | XX% |
| CAGR 2025-2034 - Market by | Country |
| China | 20.3% |
| India | 17.3% |
| Japan | XX% |
| ASEAN | XX% |
| Others | XX% |
| Australia | XX% |
Based on systems, the market is divided into conventional foodservice system, centralised foodservice system, ready prepared foodservice system, and assembly-serve foodservice system. Over the forecast period, assembly-serve foodservice systems are expected to emerge as one of the leading market segments, as they serve as an effective solution for minimising labour requirements and increasing service time for customers.
Meanwhile, centralised foodservice systems are expected to witness rapid growth during the forecast period, growing at a CAGR of 17.3% between 2025 and 2034. This can be attributed to reduced labour costs and improved efficiency offered by such systems.
Cloud kitchens are expected to become the latest model of operating business in the market as they enable restaurants to prepare and deliver food items with minimal overhead to consumers.
*While we strive to always give you current and accurate information, the numbers depicted on the website are indicative and may differ from the actual numbers in the main report. At Expert Market Research, we aim to bring you the latest insights and trends in the market. Using our analyses and forecasts, stakeholders can understand the market dynamics, navigate challenges, and capitalize on opportunities to make data-driven strategic decisions.*
Get in touch with us for a customized solution tailored to your unique requirements and save upto 35%!
The market was valued at nearly USD 406.30 Billion in 2024.
The market is projected to grow at a CAGR of 15.70% between 2025 and 2034.
The market is assessed to witness a healthy growth in the forecast period to reach around USD 1746.55 Billion in 2034.
The major sectors in the market include commercial and non-commercial.
The different systems in the market include conventional foodservice system, centralised foodservice system, ready prepared foodservice system, and assembly-serve foodservice system.
The different restaurants considered in the market report include fast food restaurants, full-service restaurants, limited-service restaurants, and special food services restaurants.
The different countries covered in the market report are China, Japan, India, ASEAN, and Australia, among others.
The key market players are McDonald’s Corporation, Domino’s Pizza Inc., Yum! Brands, Inc., Burger King Corporation, DD IP Holder LLC (Golden Donuts Inc), Tim Hortons Restaurants International GmbH, J.CO Donuts & Coffee’s, Nando’s, Subway IP LLC, and Starbucks Corporation, among others.
Explore our key highlights of the report and gain a concise overview of key findings, trends, and actionable insights that will empower your strategic decisions.
| REPORT FEATURES | DETAILS |
| Base Year | 2024 |
| Historical Period | 2018-2024 |
| Forecast Period | 2025-2034 |
| Scope of the Report |
Historical and Forecast Trends, Industry Drivers and Constraints, Historical and Forecast Market Analysis by Segment:
|
| Breakup by Sector |
|
| Breakup by Systems |
|
| Breakup by Restaurants |
|
| Breakup by Region |
|
| Market Dynamics |
|
| Competitive Landscape |
|
| Companies Covered |
|
Datasheet
One User
USD 2,499
USD 2,249
tax inclusive*
Single User License
One User
USD 3,999
USD 3,599
tax inclusive*
Five User License
Five User
USD 4,999
USD 4,249
tax inclusive*
Corporate License
Unlimited Users
USD 5,999
USD 5,099
tax inclusive*
*Please note that the prices mentioned below are starting prices for each bundle type. Kindly contact our team for further details.*
Flash Bundle
Small Business Bundle
Growth Bundle
Enterprise Bundle
*Please note that the prices mentioned below are starting prices for each bundle type. Kindly contact our team for further details.*
Flash Bundle
Number of Reports: 3
20%
tax inclusive*
Small Business Bundle
Number of Reports: 5
25%
tax inclusive*
Growth Bundle
Number of Reports: 8
30%
tax inclusive*
Enterprise Bundle
Number of Reports: 10
35%
tax inclusive*
How To Order
Our step-by-step guide will help you select, purchase, and access your reports swiftly, ensuring you get the information that drives your decisions, right when you need it.

Select License Type
Choose the right license for your needs and access rights.

Click on ‘Buy Now’
Add the report to your cart with one click and proceed to register.

Select Mode of Payment
Choose a payment option for a secure checkout. You will be redirected accordingly.
Track prices with detailed trend reports.

Analyse trade data for supply chain insights.

Leverage cost reports for smart savings

Enhance supply chain with partnerships.

Gain insights to stay ahead and seize opportunities.

Get insights & trends for a competitive edge.

Track prices with detailed trend reports.
Analyse trade data for supply chain insights.
Leverage cost reports for smart savings
Enhance supply chain with partnerships.
Gain insights to stay ahead and seize opportunities.
Get insights & trends for a competitive edge.
Track prices with detailed trend reports.
Analyse trade data for supply chain insights.
Connect For More Information
Our expert team of analysts will offer full support and resolve any queries regarding the report, before and after the purchase.
Our expert team of analysts will offer full support and resolve any queries regarding the report, before and after the purchase.
We employ meticulous research methods, blending advanced analytics and expert insights to deliver accurate, actionable industry intelligence, staying ahead of competitors.
Our skilled analysts offer unparalleled competitive advantage with detailed insights on current and emerging markets, ensuring your strategic edge.
We offer an in-depth yet simplified presentation of industry insights and analysis to meet your specific requirements effectively.
Australia
63 Fiona Drive, Tamworth, NSW
+61-448-061-727
India
C130 Sector 2 Noida, Uttar Pradesh 201301
+91-723-689-1189
Philippines
40th Floor, PBCom Tower, 6795 Ayala Avenue Cor V.A Rufino St. Makati City,1226.
+63-287-899-028, +63-967-048-3306
United Kingdom
6 Gardner Place, Becketts Close, Feltham TW14 0BX, Greater London
+44-753-713-2163
United States
30 North Gould Street, Sheridan, WY 82801
+1-415-325-5166
Vietnam
193/26/4 St.no.6, Ward Binh Hung Hoa, Binh Tan District, Ho Chi Minh City
+84-865-399-124
United States (Head Office)
30 North Gould Street, Sheridan, WY 82801
+1-415-325-5166
Australia
63 Fiona Drive, Tamworth, NSW
+61-448-061-727
India
C130 Sector 2 Noida, Uttar Pradesh 201301
+91-723-689-1189
Philippines
40th Floor, PBCom Tower, 6795 Ayala Avenue Cor V.A Rufino St. Makati City, 1226.
+63-287-899-028, +63-967-048-3306
United Kingdom
6 Gardner Place, Becketts Close, Feltham TW14 0BX, Greater London
+44-753-713-2163
Vietnam
193/26/4 St.no.6, Ward Binh Hung Hoa, Binh Tan District, Ho Chi Minh City
+84-865-399-124


Share