

Consumer Insights
Uncover trends and behaviors shaping consumer choices today
Procurement Insights
Optimize your sourcing strategy with key market data
Industry Stats
Stay ahead with the latest trends and market analysis.
Trending Now


The Asia Pacific cookware market size reached around USD 17.34 Billion in 2024. The market is projected to grow at a CAGR of 5.90% between 2025 and 2034 to reach nearly USD 30.76 Billion by 2034. The market growth can be attributed to the growing trend of home cooking, the robust growth of the e-commerce sector, technological advancements and innovations, and the rising demand for multifunctional cookware.
Base Year
Historical Period
Forecast Period
Consumers in the region are frequently cooking at home due to the growing health-consciousness, evolving lifestyles, and rising food prices. As per industry reports, the weekly cooking rate in East Asia reached 6.7 meals weekly in 2022. With consumers cooking more frequently, the demand for specialised cookware such as rice cookers, woks, and sushi mats that cater to specific cultural preferences in the region is surging.
The robust growth of the foodservice sector is boosting the Asia Pacific cookware market revenue. Reportedly, the Indian foodservice sector is projected to reach USD 93.16 billion by 2028. As the foodservice sector expands, key players are launching durable and high-quality cookware that can withstand heavy usage while delivering consistent performance. For instance, in March 2024, Tramontina launched professional cookware in India to meet the growing demand for high-quality culinary solutions from luxury restaurants, hotels, and other establishments in the hospitality industry.
In the Asia Pacific, there is a growing demand for stainless steel cookware owing to its non-reactive nature, durability, and aesthetic appeal. The rising awareness regarding food safety and the potential dangers associated with various materials such as Teflon and aluminium is also surging the demand for stainless steel cookware. In the forecast period, the increasing focus on sustainability is anticipated to position stainless steel cookware as a sustainable option to non-stick cookware.


Value in USD Billion
2025-2034
Asia Pacific Cookware Market Outlook
*this image is indicative*
|
Asia Pacific Cookware Market Report Summary |
Description |
Value |
|
Base Year |
USD Billion |
2024 |
|
Historical Period |
USD Billion |
2018-2024 |
|
Forecast Period |
USD Billion |
2025-2034 |
|
Market Size 2024 |
USD Billion |
17.34 |
|
Market Size 2034 |
USD Billion |
30.76 |
|
CAGR 2018-2024 |
Percentage |
XX% |
|
CAGR 2025-2034 |
Percentage |
5.90% |
|
CAGR 2025-2034- Market by Country |
India |
6.8% |
|
CAGR 2025-2034 - Market by Country |
China |
5.6% |
|
CAGR 2025-2034 - Market by Material |
Stainless Steel |
6.3% |
|
CAGR 2025-2034 - Market by Distribution Channel |
Online |
9.1% |
|
Market Share by Country 2024 |
ASEAN |
14.9% |
The Southeast Asia and Asia Pacific region recorded an average consumption of 10.9 meals weekly in 2022, which was a substantial growth from 10.3 meals in 2021. The cooking rate largely remained stable (7.2), with Laos recording the highest home cooking rate at 12.3 meals weekly. The sustained growth in the demand for home cooked food is expected to bolster the Asia Pacific cookware market expansion in the upcoming years.
In southern parts of Asia, single-person households displayed the highest cooking frequency and consumed all their meals. On average, they cooked 8.0 meals weekly and consumed 8.7 home-cooked meals weekly. On the other hand, two person households prepared 6.5 meals weekly. This is expected to bolster the Asia Pacific cookware market development in the forecast period.
Based on the market analysis, rural areas exhibit the greatest cooking frequency in the region, due to a strong connection to conventional cooking practices, a slow-paced lifestyle, and access to fresh, plant-based ingredients. Two-person households consume around 8.0 meals weekly, which increases as the size of the households. This is expected to play a significant role in influencing the market dynamics in the upcoming years.
Rising adoption of induction stoves; the introduction of stylish designs of cookware; the soaring appeal of multifunctional cookware; and the launch of smart cookware are the major factors favouring the Asia Pacific cookware market growth.
Numerous households are adopting induction stoves since they are safer and easier to clean. Moreover, they allow users to control cooking temperature precisely and reduce gas bills. This is surging the demand for induction stove-compatible cookware.
Consumers are seeking functional cookware products that also double up as kitchen décor. This is prompting manufacturers to create sleek designs and imprint bright, bold colours on cookware.
As urban spaces become smaller, the demand for multifunctional cookware that can be simultaneously used for baking, frying, and steaming is gaining market traction. This is expected to increase the Asia Pacific cookware market value in the coming years.
Cookware integrated with smart features, including connectivity to cooking applications and temperature sensors, is becoming increasingly common. These are enabling consumers to achieve enhanced flavours and texture of cooked foods.

The Asia Pacific is expected to witness a substantial surge in the demand for hard anodised cookware since it is extremely durable and abrasion-resistant. It heats up evenly in a short time and is ideally suited for low-fat cooking. It is easy to clean and maintain, and it allows for healthier cooking due to the presence of a non-stick layer. The introduction of hard anodised cookware in unique designs and colours is expected to propel the Asia Pacific cookware market development. Moreover, the region is witnessing a strong demand for multifunctional cookware as it is affordable, enables customers to prepare meals faster, reduces the need for multiple appliances, and empowers users to experiment with different preparation methods.
The EMR’s report titled “Asia Pacific Cookware Market Report and Forecast 2025-2034” offers a detailed analysis of the market based on the following segments:
Breakup by Type
Breakup by Material
Breakup by Application
Breakup by Distribution Channel
Breakup by Country
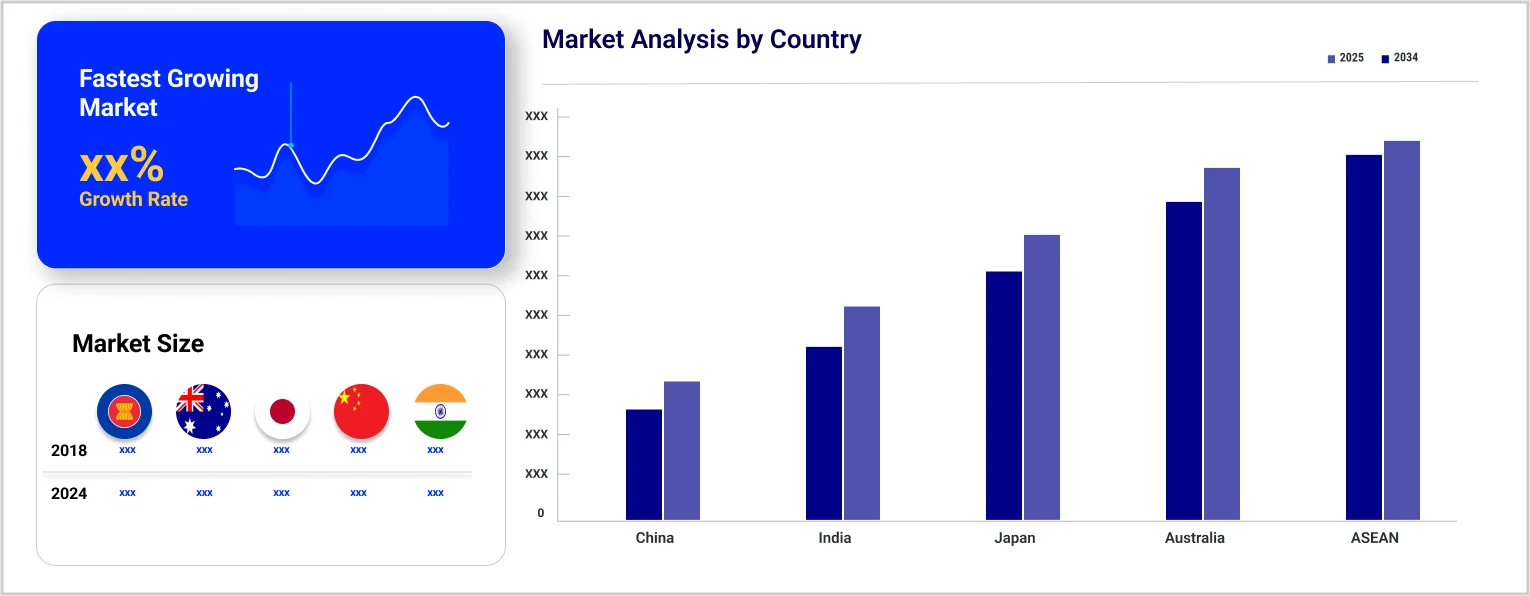
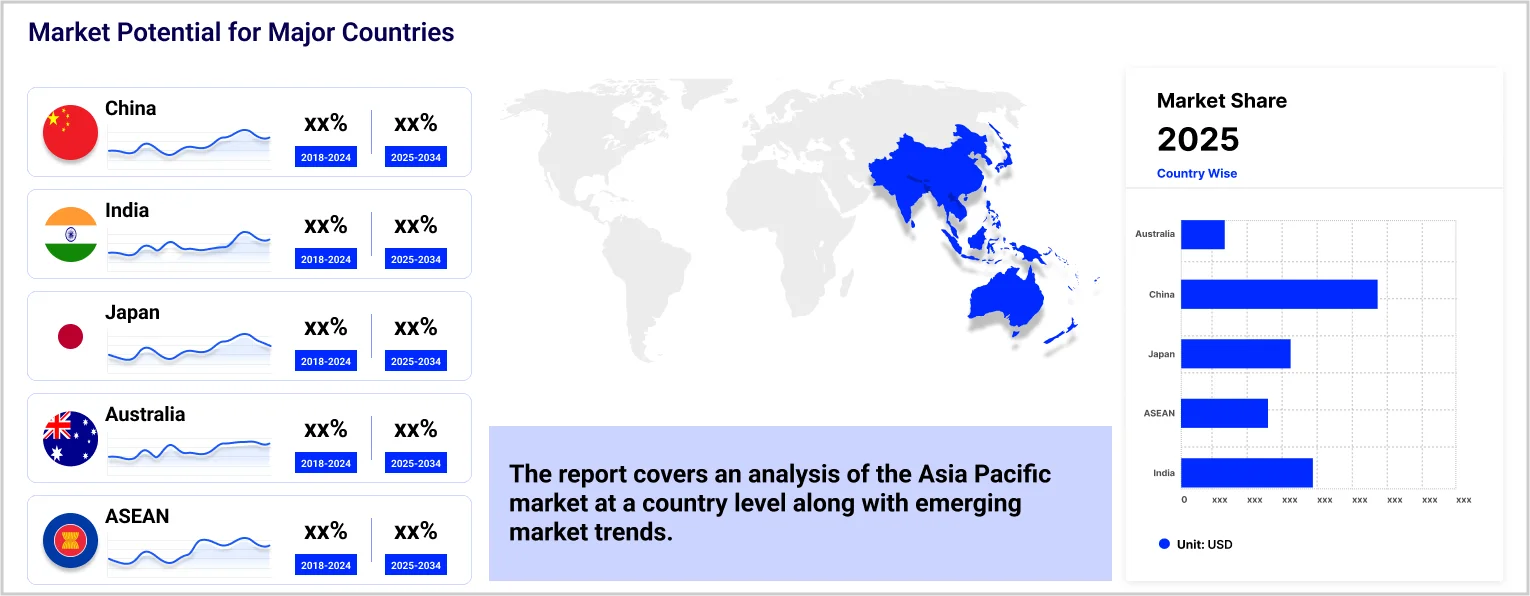
Based on country, the market is segmented into China, Japan, India, ASEAN, and Australia, among others. Over the forecast period of 2025-2034, the demand for cookware in India and China is expected to grow at a CAGR of 6.8% and 5.6%, respectively. The Asia Pacific cookware market size in these regions is expected to expand due to the introduction of new product models and the rising appeal for aesthetic and multifunctional cookware.
|
CAGR 2025-2034 - Market by |
Country |
|
India |
6.8% |
|
China |
5.6% |
|
Japan |
XX% |
|
Australia |
XX% |
|
ASEAN |
XX% |
Major market players like TTK Prestige are venturing into the category of premium cookware combining high-end material and superior craftsmanship, which is expected to increase the Asia Pacific cookware market revenue. They are also investing in D2C models to expand their online presence and offer convenient shopping experiences and personalised customer services.
Meyer Corporation was formed in 1951 and is based in California, United States. It is amongst the leading cookware manufacturing companies whose factories produce over 120,000 pans daily for 300+ days annually.
TTK Prestige Ltd. was founded in 1928 and is headquartered in Karnataka, India. It is India’s topmost kitchen appliance brand and manufactures non-stick cookware items, including pressure cookers, and other items.
Wonderchef Home Appliances Pvt. Ltd. was founded in 2009 and is headquartered in Mumbai, Maharashtra. It is engaged in manufacturing premium cookware products and home appliances.
Fissler GmbH was formed in 1845 and is based in Rheinland-Pfalz, Germany. It specialises in designing a wide range of premium cooking products and accessories.
*Please note that this is only a partial list; the complete list of key players is available in the full report. Additionally, the list of key players can be customized to better suit your needs.*
Other players included in the Asia Pacific cookware market report are Wilh. Werhahn KG, Groupe SEB, The Vollrath Co., L.L.C., Sunbeam Products, Inc, Hawkins Cookers Limited, and Target Brands, Inc., among others.
*While we strive to always give you current and accurate information, the numbers depicted on the website are indicative and may differ from the actual numbers in the main report. At Expert Market Research, we aim to bring you the latest insights and trends in the market. Using our analyses and forecasts, stakeholders can understand the market dynamics, navigate challenges, and capitalize on opportunities to make data-driven strategic decisions.*
Get in touch with us for a customized solution tailored to your unique requirements and save upto 35%!
In 2024, the market reached an approximate value of USD 17.34 Billion.
The market is projected to grow at a CAGR of 5.90% between 2025 and 2034.
The market is estimated to witness healthy growth in the forecast period of 2025-2034 to reach a value of around USD 30.76 Billion by 2034.
The different countries considered in the market report include China, Japan, India, ASEAN, and Australia, among others.
The different distribution channels for cookware include online and offline.
The different materials used for making cookware include stainless steel, aluminium, and glass, among others.
The different applications of cookware include residential and commercial.
Key players in the market are Wilh. Werhahn KG, Groupe SEB, Meyer Corporation, TTK Prestige Ltd., Fissler GmbH, The Vollrath Co., L.L.C., Sunbeam Products, Inc, Hawkins Cookers Limited, Wonderchef Home Appliances Pvt. Ltd., and Target Brands, Inc., among others.
Explore our key highlights of the report and gain a concise overview of key findings, trends, and actionable insights that will empower your strategic decisions.
| REPORT FEATURES | DETAILS |
| Base Year | 2024 |
| Historical Period | 2018-2024 |
| Forecast Period | 2025-2034 |
| Scope of the Report |
Historical and Forecast Trends, Industry Drivers and Constraints, Historical and Forecast Market Analysis by Segment:
|
| Breakup by Type |
|
| Breakup by Material |
|
| Breakup by Application |
|
| Breakup by Distribution Channel |
|
| Breakup by Region |
|
| Market Dynamics |
|
| Competitive Landscape |
|
| Companies Covered |
|
Datasheet
One User
USD 2,499
USD 2,249
tax inclusive*
Single User License
One User
USD 3,999
USD 3,599
tax inclusive*
Five User License
Five User
USD 4,999
USD 4,249
tax inclusive*
Corporate License
Unlimited Users
USD 5,999
USD 5,099
tax inclusive*
*Please note that the prices mentioned below are starting prices for each bundle type. Kindly contact our team for further details.*
Flash Bundle
Small Business Bundle
Growth Bundle
Enterprise Bundle
*Please note that the prices mentioned below are starting prices for each bundle type. Kindly contact our team for further details.*
Flash Bundle
Number of Reports: 3
20%
tax inclusive*
Small Business Bundle
Number of Reports: 5
25%
tax inclusive*
Growth Bundle
Number of Reports: 8
30%
tax inclusive*
Enterprise Bundle
Number of Reports: 10
35%
tax inclusive*
How To Order
Our step-by-step guide will help you select, purchase, and access your reports swiftly, ensuring you get the information that drives your decisions, right when you need it.

Select License Type
Choose the right license for your needs and access rights.

Click on ‘Buy Now’
Add the report to your cart with one click and proceed to register.

Select Mode of Payment
Choose a payment option for a secure checkout. You will be redirected accordingly.
Track prices with detailed trend reports.

Analyse trade data for supply chain insights.

Leverage cost reports for smart savings

Enhance supply chain with partnerships.

Gain insights to stay ahead and seize opportunities.

Get insights & trends for a competitive edge.

Track prices with detailed trend reports.
Analyse trade data for supply chain insights.
Leverage cost reports for smart savings
Enhance supply chain with partnerships.
Gain insights to stay ahead and seize opportunities.
Get insights & trends for a competitive edge.
Track prices with detailed trend reports.
Analyse trade data for supply chain insights.
Connect For More Information
Our expert team of analysts will offer full support and resolve any queries regarding the report, before and after the purchase.
Our expert team of analysts will offer full support and resolve any queries regarding the report, before and after the purchase.
We employ meticulous research methods, blending advanced analytics and expert insights to deliver accurate, actionable industry intelligence, staying ahead of competitors.
Our skilled analysts offer unparalleled competitive advantage with detailed insights on current and emerging markets, ensuring your strategic edge.
We offer an in-depth yet simplified presentation of industry insights and analysis to meet your specific requirements effectively.
Australia
63 Fiona Drive, Tamworth, NSW
+61-448-061-727
India
C130 Sector 2 Noida, Uttar Pradesh 201301
+91-723-689-1189
Philippines
40th Floor, PBCom Tower, 6795 Ayala Avenue Cor V.A Rufino St. Makati City,1226.
+63-287-899-028, +63-967-048-3306
United Kingdom
6 Gardner Place, Becketts Close, Feltham TW14 0BX, Greater London
+44-753-713-2163
United States
30 North Gould Street, Sheridan, WY 82801
+1-415-325-5166
Vietnam
193/26/4 St.no.6, Ward Binh Hung Hoa, Binh Tan District, Ho Chi Minh City
+84-865-399-124
United States (Head Office)
30 North Gould Street, Sheridan, WY 82801
+1-415-325-5166
Australia
63 Fiona Drive, Tamworth, NSW
+61-448-061-727
India
C130 Sector 2 Noida, Uttar Pradesh 201301
+91-723-689-1189
Philippines
40th Floor, PBCom Tower, 6795 Ayala Avenue Cor V.A Rufino St. Makati City, 1226.
+63-287-899-028, +63-967-048-3306
United Kingdom
6 Gardner Place, Becketts Close, Feltham TW14 0BX, Greater London
+44-753-713-2163
Vietnam
193/26/4 St.no.6, Ward Binh Hung Hoa, Binh Tan District, Ho Chi Minh City
+84-865-399-124


Share