

Consumer Insights
Uncover trends and behaviors shaping consumer choices today
Procurement Insights
Optimize your sourcing strategy with key market data
Industry Stats
Stay ahead with the latest trends and market analysis.

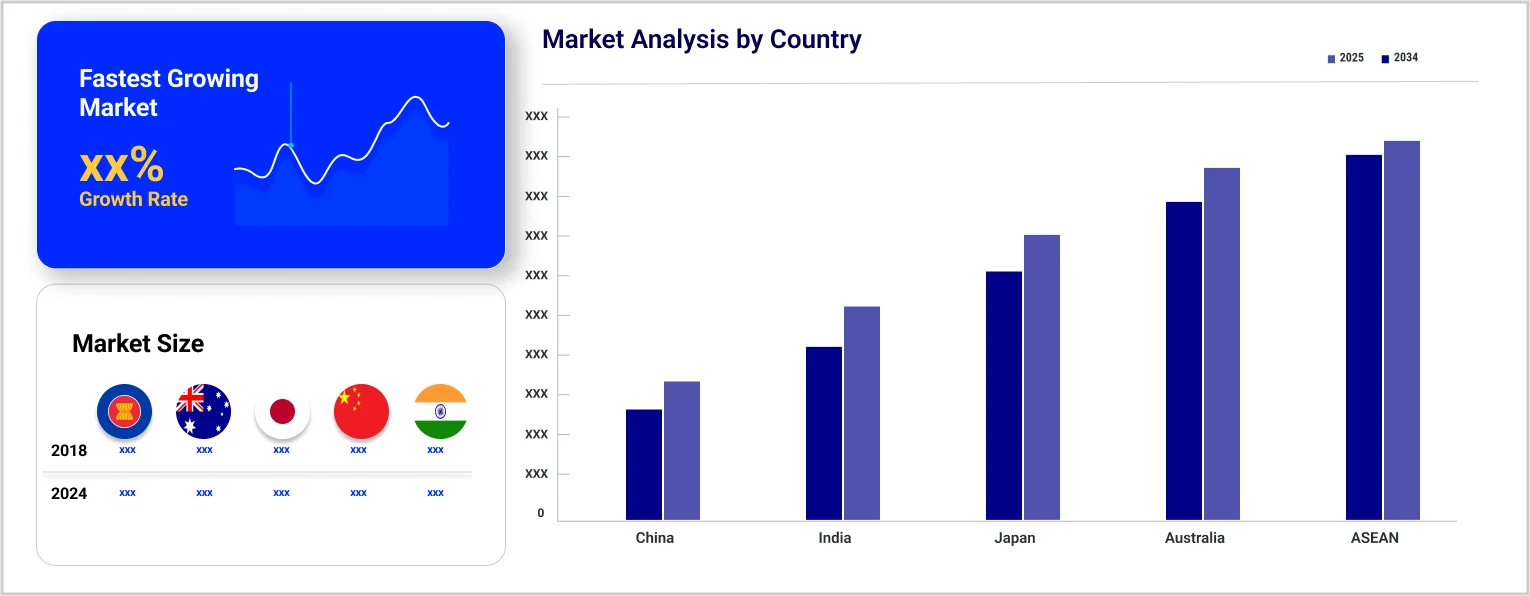
The Asia Pacific condom market reached around USD 5.26 Billion in 2025. The market is projected to grow at a CAGR of 9.80% between 2026 and 2035 to reach nearly USD 13.40 Billion by 2035.
Base Year
Historical Period
Forecast Period
As per the Australian government, one in two people feel confused about the concept of sexual consent.
In 2023, Thailand exported condoms worth $272.26 million to foreign countries.
In India, 5.6% of the male population that is sexually active uses condoms.
Compound Annual Growth Rate
9.8%
Value in USD Billion
2026-2035
*this image is indicative*
| Asia-Pacific Condom Market Report Summary | Description | Value |
| Base Year | USD Billion | 2025 |
| Historical Period | USD Billion | 2019-2025 |
| Forecast Period | USD Billion | 2026-2035 |
| Market Size 2025 | USD Billion | 5.26 |
| Market Size 2035 | USD Billion | 13.40 |
| CAGR 2019-2025 | Percentage | XX% |
| CAGR 2026-2035 | Percentage | 9.80% |
| CAGR 2026-2035 - Market by Country | India | 11.2% |
| CAGR 2026-2035 - Market by Country | China | 9.5% |
| CAGR 2026-2035 - Market by Type | Non-Latex | 10.8% |
| CAGR 2026-2035 - Market by Distribution Channel | Online Channels | 15.7% |
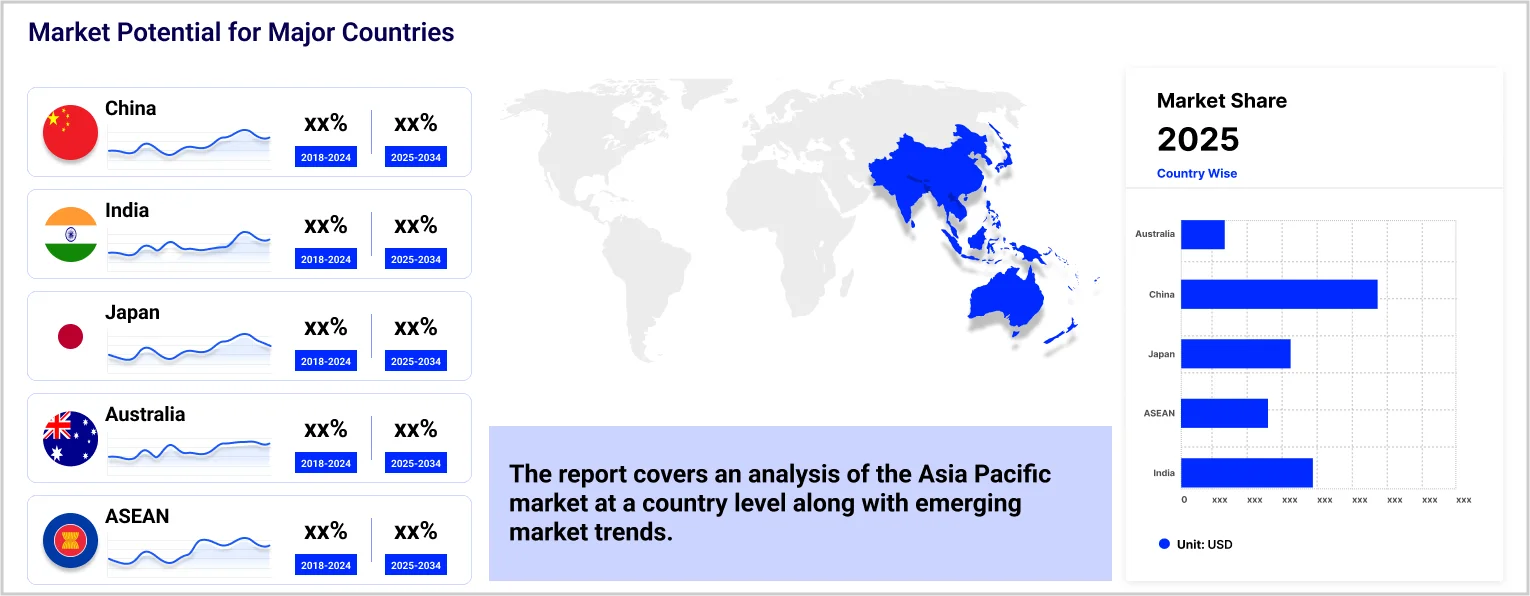
| 2025 Market Share by Country | Australia | 4.3% |
Changing media consumption habits among the Chinese have prompted intimate wellness companies to explore live streaming as a sales channel for condoms. In 2022, $238 billion worth of products were sold through live-streaming in China, which is expected to cross $300 billion by 2025-26. As per the China Business Research Institute, domestic condom sales are expected to reach $5.2 billion in 2024.
Thailand’s condom exports constitute a 44% share of the global condom market. China, the United States of America, and Vietnam are the leading condom importers.
Correct usage of male (and female) condoms can prevent unplanned pregnancies in 98% of women. In 2020, sexually transmitted infections such as syphilis, gonorrhoea, chlamydia, and trichomoniasis affected 374 million people aged between 15-49 years globally. Easy accessibility and affordability to condoms can prevent their occurrence. Interventions that focus on using positive language for sex and sexual pleasure can significantly boost the adoption of condoms among people, which can contribute to the market growth.
Major condom manufacturers in Australia are creating consumer awareness around the importance of obtaining sexual consent from their partners. This is done by increasing innovations in packaging design and incorporating unique catchphrases that highlight the pleasure obtained through consensual sex.

Asia Pacific Condom Market Report and Forecast 2026-2035 offers a detailed analysis of the market based on the following segments:
Market Breakup by Type
Market Breakup by End User
Market Breakup by Distribution Channel
Market Breakup by Country
| CAGR 2026-2035 - Market by | Country |
| India | 11.2% |
| China | 9.5% |
| Japan | XX% |
| ASEAN | XX% |
| Australia | XX% |
| Others | XX% |
Based on distribution channel, the market is segmented into hypermarkets/supermarkets, chemist shops, and online channels, among others. Over the forecast period of 2026-2035, online channels are expected to grow at a CAGR of 15.7%, due to rising internet accessibility and smartphone penetration rates.
| 2025 Market Share by | Country |
| Australia | 4.3% |
| China | XX% |
| Japan | XX% |
| India | XX% |
| ASEAN | XX% |
| Others | XX% |
Increasing emphasis on medical education in Malaysia has led to the discovery of unisex condoms by gynaecologists, which are produced from polyurethane and have an adhesive covering on one side.


Upto 15% Off
USD
$3999 $3599
$2499 $2249
$4999 $4249
$5999 $5099


*While we strive to always give you current and accurate information, the numbers depicted on the website are indicative and may differ from the actual numbers in the main report. At Expert Market Research, we aim to bring you the latest insights and trends in the market. Using our analyses and forecasts, stakeholders can understand the market dynamics, navigate challenges, and capitalize on opportunities to make data-driven strategic decisions.*
Get in touch with us for a customized solution tailored to your unique requirements and save upto 35%!
The market reached nearly USD 5.26 Billion in 2025.
The market is projected to grow at a CAGR of 9.80% between 2026 and 2035.
The market is assessed to witness healthy growth in the forecast period to reach around USD 13.40 Billion in 2035.
The different types of condoms in the market are latex and non-latex.
The different end users of condoms are men and women.
The different distribution channels of condoms in the market are hypermarkets/supermarkets, chemist shops, and online channels, among others.
The different countries covered in the market report are China, Japan, India, ASEAN, and Australia, among others.
The key market players are Okamoto Industries,Inc., Sagami Rubber Industries Co., Ltd., Karex Berhad, Cupid Limited, HLL Lifecare Limited, Mankind Pharma Ltd., Reckitt Benckiser Group PLC, Glyde Health, and THAI NIPPON RUBBER INDUSTRY PUBLIC COMPANY LIMITED., among others.
Explore our key highlights of the report and gain a concise overview of key findings, trends, and actionable insights that will empower your strategic decisions.
| REPORT FEATURES | DETAILS |
| Base Year | 2025 |
| Historical Period | 2019-2025 |
| Forecast Period | 2026-2035 |
| Scope of the Report |
Historical and Forecast Trends, Industry Drivers and Constraints, Historical and Forecast Market Analysis by Segment:
|
| Breakup by Type |
|
| Breakup by End User |
|
| Breakup by Distribution Channel |
|
| Breakup by Region |
|
| Market Dynamics |
|
| Competitive Landscape |
|
| Companies Covered |
|
Single User License
One User
USD 3,999
USD 3,599
tax inclusive*
Datasheet
One User
USD 2,499
USD 2,249
tax inclusive*
Five User License
Five User
USD 4,999
USD 4,249
tax inclusive*
Corporate License
Unlimited Users
USD 5,999
USD 5,099
tax inclusive*
*Please note that the prices mentioned below are starting prices for each bundle type. Kindly contact our team for further details.*
Flash Bundle
Small Business Bundle
Growth Bundle
Enterprise Bundle
*Please note that the prices mentioned below are starting prices for each bundle type. Kindly contact our team for further details.*
Flash Bundle
Number of Reports: 3
20%
tax inclusive*
Small Business Bundle
Number of Reports: 5
25%
tax inclusive*
Growth Bundle
Number of Reports: 8
30%
tax inclusive*
Enterprise Bundle
Number of Reports: 10
35%
tax inclusive*
How To Order

Select License Type
Choose the right license for your needs and access rights.

Click on ‘Buy Now’
Add the report to your cart with one click and proceed to register.

Select Mode of Payment
Choose a payment option for a secure checkout. You will be redirected accordingly.
Gain insights to stay ahead and seize opportunities.

Get insights & trends for a competitive edge.

Track prices with detailed trend reports.

Analyse trade data for supply chain insights.

Leverage cost reports for smart savings

Enhance supply chain with partnerships.

Connect For More Information
Our expert team of analysts will offer full support and resolve any queries regarding the report, before and after the purchase.
Our expert team of analysts will offer full support and resolve any queries regarding the report, before and after the purchase.
We employ meticulous research methods, blending advanced analytics and expert insights to deliver accurate, actionable industry intelligence, staying ahead of competitors.
Our skilled analysts offer unparalleled competitive advantage with detailed insights on current and emerging markets, ensuring your strategic edge.
We offer an in-depth yet simplified presentation of industry insights and analysis to meet your specific requirements effectively.


Share