Explore Our Diverse Range Of Offerings
From detailed reports to experts services offered in 15+ Industry Domains
Report
Press Release
Blogs
Industry Statistics
Add 2 More Reports For 20% off

Report Overview

The Asia Pacific computer monitor market reached USD 9.81 Billion in 2024. The market is expected to grow at a CAGR of 5.60% between 2025 and 2034, reaching USD 16.92 Billion by 2034.

2024

Base Year

2018-2024

Historical Year

2025-2034

Forecast Year

  • As per the International Trade Administration , Japanese companies are estimated to spend USD 4.1 billion on digital infrastructure in 2030.

  • Industry output in computer, electronic & optical products manufacturing in 2023 was over SGD 175 billion.

  • As per data released by Australia  in 2023, multiplatform end-to-end digital game development income was over AUD 181 million.

Compound Annual Growth Rate

Value in USD Billion

5.6%

2025-2034


Asia Pacific Computer Monitor Market Outlook

*this image is indicative*

Asia Pacific Computer Monitor Market Growth

The Asia Pacific computer monitor market growth is led by applications in commercial spaces like offices and educational institutes.

In professional terms, monitors are vital in different commercial settings, ranging from corporate offices to educational institutes. They prioritize ergonomic design and eye-care technologies that help improve productivity and reduce strain during long working hours. They also serve well in retail and hospitality like digital signage, customer service kiosks, and point-of-sale systems, enhancing customer experience.

Growth in the computer monitors market is led by rising commercial and personal uses, rising spending in manufacturing, and higher incomes in game development. As of April 2024, Xiaomi in China launched its new Redmi G27Q gaming monitor at USD 124 for gamers on a budget.

In the context of gaming culture within the domestic region, gaming monitors are sold at e-sport arenas and game cafes. These screens deliver high rates of refreshment and low response times that give gamers an edge and provide more immersive experiences. Such home-based gaming stations also increase demand among consumers who are looking for devices that can give them clear images with vibrant colors.

Asia Pacific Computer Monitor Market Segmentation

Asia Pacific Computer Monitor Market Report and Forecast 2025-2034 offers a detailed analysis of the market based on the following segments:

Market Breakup by Type:

  • LCD Monitor
  • LED Monitor
  • CRT
  • Others

Market Breakup by Size:

  • Small
  • Large

Market Breakup by Application:

  • Commercial
  • Gaming
  • Others

Market Breakup by Country:

  • China
  • Japan
  • India
  • ASEAN
  • Australia
  • Others

Asia Pacific Computer Monitor Market Share

For the monitor market in the domestic region, LED monitors represent a newer generation of display technology since they have higher levels of brightness and offer higher contrast levels which results in better overall image quality. LED monitors also allow for a thinner monitor profile when compared to a traditional LCD display.

Leading Companies in the Asia Pacific Computer Monitor Market

The report provides a detailed analysis of the following key players in the market, covering their competitive landscape and the latest developments like mergers and acquisitions, investments, and technological innovation.

  • Apple Inc.
  • Samsung Electronics Co., Ltd.
  • LG Corporation
  • Dell Inc.
  • ASUSTEK Computer Inc.
  • HP Inc.
  • ViewSonic Corporation
  • BenQ Corporation
  • Acer Inc.
  • Razer Inc.
  • Others

Major market players are expanding their outreach by establishing their standalone brand outlets in strategic areas like airports and busy markets. This enhances their visibility to international tourists and consumers, thereby contributing to market growth.

*While we strive to always give you current and accurate information, the numbers depicted on the website are indicative and may differ from the actual numbers in the main report. At Expert Market Research, we aim to bring you the latest insights and trends in the market. Using our analyses and forecasts, stakeholders can understand the market dynamics, navigate challenges, and capitalize on opportunities to make data-driven strategic decisions.*

Looking for specific insights?

Get in touch with us for a customized solution tailored to your unique requirements and save upto 35%!

Key Questions Answered in the Report

The market was valued at USD 9.81 Billion in 2024.

The market is projected to grow at a CAGR of 5.60% between 2025 and 2034.

The revenue generated from the market is expected to reach USD 16.92 Billion in 2034.

Based on type, the computer monitor market is split into LCD Monitor, LED Monitor, CRT, and others.

The market key players are Apple Inc., Samsung Electronics Co., Ltd., LG Corporation, Dell Inc., ASUSTEK Computer Inc., HP Inc., ViewSonic Corporation, BenQ Corporation, Acer Inc., and Razer Inc., among others.

Based on the application, the market is split between commercial, gaming, and others.

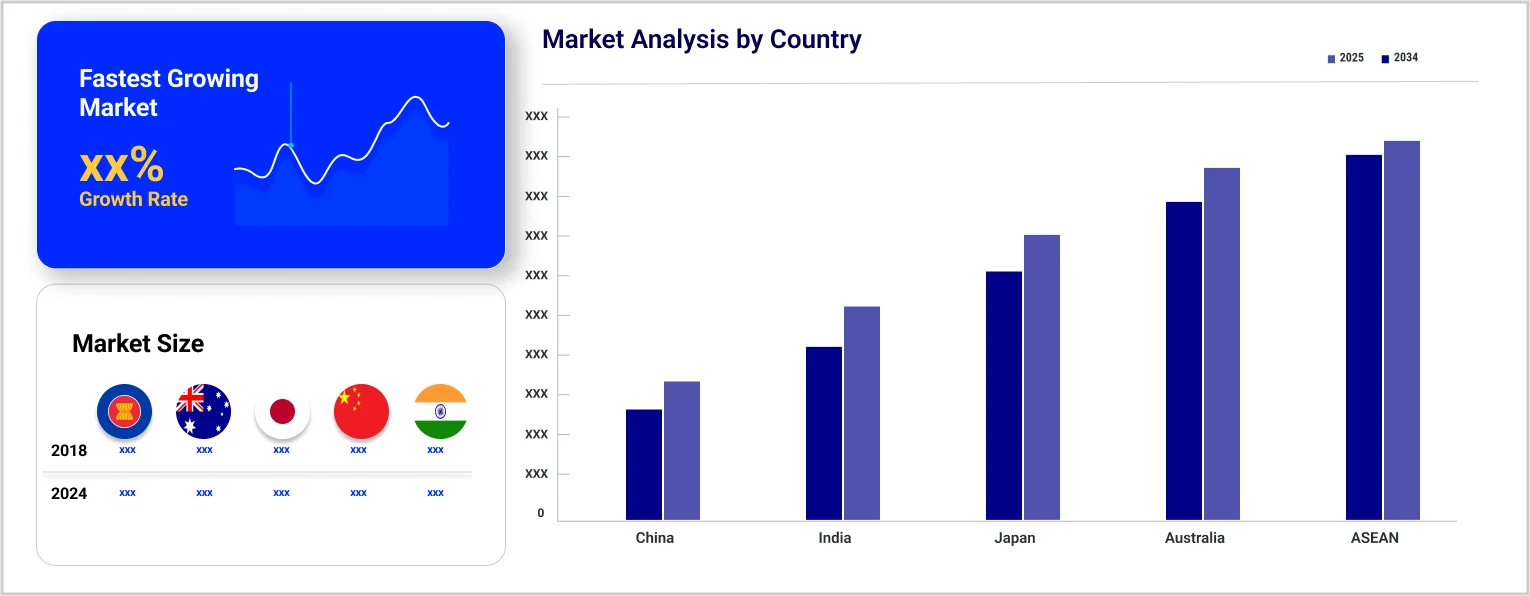
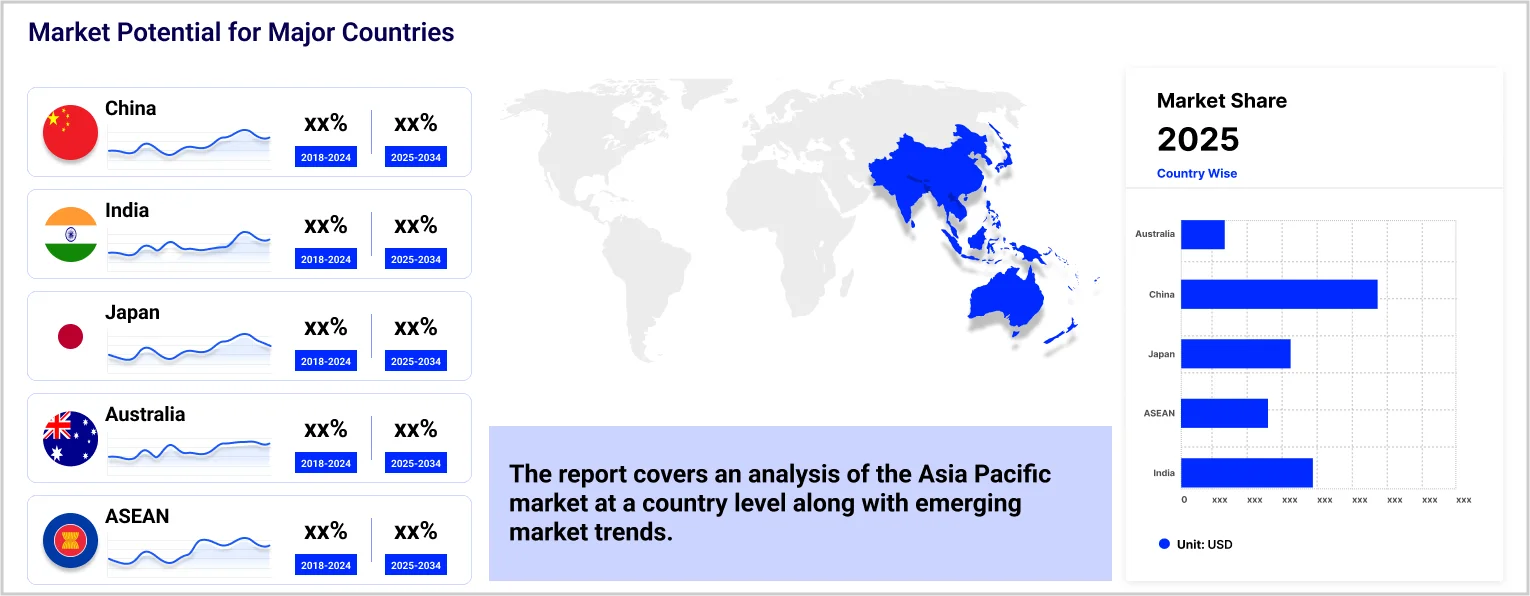
Based on the country, the market is split into China, Japan, India, ASEAN, Australia and others.

Report Summary

Explore our key highlights of the report and gain a concise overview of key findings, trends, and actionable insights that will empower your strategic decisions.

Key Highlights of the Report

Please note that the figures mentioned in the description serve as estimates and may vary from the actual figures presented in the final report.

REPORT FEATURES DETAILS
Base Year 2024
Historical Period 2018-2024
Forecast Period 2025-2034
Scope of the Report

Historical and Forecast Trends, Industry Drivers and Constraints, Historical and Forecast Market Analysis by Segment:

  • Type
  • Size
  • Application
  • Region
Breakup by Type
  • LCD Monitor
  • LED Monitor
  • CRT
  • Others
Breakup by Size
  • Small
  • Large
Breakup by Application
  • Commercial
  • Gaming
  • Others
Breakup by Region
  • China
  • Japan
  • India
  • ASEAN
  • Australia
  • Others
Market Dynamics
  • SWOT Analysis
  • Porter's Five Forces Analysis
  • Key Indicators for Demand
  • Key Indicators for Price
Competitive Landscape
  • Market Structure
  • Company Profiles
    • Company Overview
    • Product Portfolio
    • Demographic Reach and Achievements
    • Certifications
Companies Covered
  • Apple Inc.
  • Samsung Electronics Co., Ltd.
  • LG Corporation
  • Dell Inc.
  • ASUSTEK Computer Inc.
  • HP Inc.
  • ViewSonic Corporation
  • BenQ Corporation
  • Acer Inc.
  • Razer Inc
  • Others

Single User License

10 % Off

USD

3,999

3,599

Datasheet

10 % Off

USD

2,499

2,249

Five User License

15 % Off

USD

4,999

4,249

Corporate License

15 % Off

USD

5,999

5,099

  • Report Delivery
  • Purchase Advantages
  • Access Duration
  • Analyst Support
  • Discount on Future Updates
  • Customisation Options
  • Customisation Requests
  • Excel Data Sheet
  • Online Access
  • PDF Format
  • PPT/Word Format
  • 1 Print Allowed
  • Bulk Purchase Discounts
  • Full Report Access
  • Multi-Device Access
  • Unlimited Access
  • One-Time Purchase
  • 3-Month Trade Data Access
  • Consultation Hours
  • Email Support
  • Phone Support
  • Up to 15 Analyst Hours
  • Up to 30 Analyst Hours
  • 5% Discount
  • 10% Discount
  • 15% Discount
  • 20% Discount
  • Basic (Up to 10%)
  • Advanced (Up to 50%)
  • Dedicated Analyst Access
  • Data Visualization Access
  • Custom Data Queries
  • Custom Report Layouts
  • Tailored Custom Summaries
  • Dashboard
  • Purchase Advantages
  • Report Delivery
  • Access Duration
  • Analyst Support
  • Discount on Future Updates
  • Customisation Options
  • Customisation Requests
  • 1 Print Allowed
  • Full Report Access
  • Bulk Purchase Discounts
  • Multi-Device Access
  • PDF Format
  • Online Access
  • Excel Data Sheet
  • PPT/Word Format
  • Unlimited Access
  • One-Time Purchase
  • 3-Month Trade Data Access
  • Consultation Hours
  • Email Support
  • Phone Support
  • Up to 15 Analyst Hours
  • Up to 30 Analyst Hours
  • 5% Discount
  • 10% Discount
  • 15% Discount
  • 20% Discount
  • Basic (Up to 10%)
  • Advanced (Up to 50%)
  • Dedicated Analyst Access
  • Data Visualization Access
  • Custom Data Queries
  • Custom Report Layouts
  • Tailored Custom Summaries
  • Dashboard
  • Purchase Advantages
  • Analyst Support
  • Report Delivery
  • Access Duration
  • Customisation Options
  • Discount on Future Updates
  • Customisation Requests
  • 5 Prints Allowed
  • Full Report Access
  • Bulk Purchase Discounts
  • Limited Device Access
  • Email Support
  • Phone Support
  • Up to 15 Analyst Hours
  • Up to 30 Analyst Hours
  • PDF Format
  • Online Access
  • Excel Data Sheet
  • PPT/Word Format
  • Unlimited Access
  • One-Time Purchase
  • 3-Month Trade Data Access
  • Consultation Hours
  • Basic (Up to 10%)
  • Advanced (Up to 50%)
  • Dedicated Analyst Access
  • Data Visualization Access
  • 5% Discount
  • 10% Discount
  • 15% Discount
  • 20% Discount
  • Custom Data Queries
  • Custom Report Layouts
  • Tailored Custom Summaries
  • Dashboard
  • Report Delivery
  • Purchase Advantages
  • Customisation Options
  • Customisation Requests
  • Analyst Support
  • Access Duration
  • Discount on Future Updates
  • PDF Format
  • Excel Data Sheet
  • PPT/Word Format
  • Online Access
  • Unlimited Prints Available
  • Full Report Access
  • Bulk Purchase Discounts
  • Multi-Device Access
  • Basic (Up to 10%)
  • Advanced (Up to 50%)
  • Dedicated Analyst Access
  • Data Visualization Access
  • Custom Data Queries
  • Custom Report Layouts
  • Tailored Custom Summaries
  • Dashboard
  • Email Support
  • Phone Support
  • Up to 15 Analyst Hours
  • Up to 30 Analyst Hours
  • Unlimited Access
  • One-Time Purchase
  • 3-Month Trade Data Access
  • Consultation Hours
  • 5% Discount
  • 10% Discount
  • 15% Discount
  • 20% Discount

Single User License

One User

USD 3,999

USD 3,599

tax inclusive*

  • All Segments
  • Printing Restrictions
  • PDF Delivered via Email
  • Custom Report Layout
  • Post Sales Analysts Support
  • Periodic Updates
  • Unlimited Prints

Datasheet

One User

USD 2,499

USD 2,249

tax inclusive*

  • Selected Segments
  • Printing Restrictions
  • Excel Spreadsheet Delivered via Email
  • Full Report
  • Periodic Updates
  • Post Sales Analysts Support
  • Unlimited Prints

Five User License

Five User

USD 4,999

USD 4,249

tax inclusive*

  • All Segments
  • Five Prints Available
  • PDF Delivered via Email
  • Limited Free Customization
  • Post Sales Analyst Support
  • Custom Report Layout
  • Periodic Updates
  • Unlimited Prints

Corporate License

Unlimited Users

USD 5,999

USD 5,099

tax inclusive*

  • All Segments
  • Unlimited Prints Available
  • PDF & Excel Delivery via Email
  • Limited Free Customization
  • Post Sales Analysts Support
  • Discount On Next Update
  • Custom Report Layout

*Please note that the prices mentioned below are starting prices for each bundle type. Kindly contact our team for further details.*

Bundle Type

Flash Bundle

20% OFF Number of Reports: 3

Small Business Bundle

25% OFF Number of Reports: 5

Growth Bundle

30% OFF Number of Reports: 8

Enterprise Bundle

35% OFF Number of Reports: 10
Overview
  • Life Time Access
  • Analyst Support Related to Report
  • PDF Version of the Report
  • Complimentary Excel Data Set
  • Free Analyst Hours
  • Complimentary Free 1 Month Subscription to Trade Data Base
  • Complimentary One Month Subscription to Price Database (Chemicals only)
  • Complementary PPT Version of the Report
  • Complimentary License Upgrade
  • Complimentary Power BI Dashboards
  • Life Time Access
  • Analyst Support Related to Report
  • PDF Version of the Report
  • Complimentary Excel Data Set
  • Free Analyst Hours - 50 Hours
  • Complimentary Free 1 Month Subscription to Trade Data Base
  • Complimentary One Month Subscription to Price Database (Chemicals only)
  • Complementary PPT Version of the Report
  • Complimentary License Upgrade
  • Complimentary Power BI Dashboards
  • Life Time Access
  • Analyst Support Related to Report
  • PDF Version of the Report
  • Complimentary Excel Data Set
  • Free Analyst Hours - 80 Hours
  • Complimentary Free 1 Month Subscription to Trade Data Base
  • Complimentary One Month Subscription to Price Database (Chemicals only)
  • Complementary PPT Version of the Report
  • Complimentary License Upgrade
  • Complimentary Power BI Dashboards
  • Life Time Access
  • Analyst Support Related to Report
  • PDF Version of the Report
  • Complimentary Excel Data Set
  • Free Analyst Hours - 100 Hours
  • Complimentary Free 1 Month Subscription to Trade Data Base
  • Complimentary One Month Subscription to Price Database (Chemicals only)
  • Complementary PPT Version of the Report
  • Complimentary License Upgrade
  • Complimentary Power BI Dashboards

*Please note that the prices mentioned below are starting prices for each bundle type. Kindly contact our team for further details.*

Flash Bundle

Number of Reports: 3

20%

tax inclusive*

  • 3 Reports Included
  • Life Time Acess
  • Analyst Support Related to Report
  • PDF Version of the Report
  • Free 1 Month Subscription to Trade Data Base
  • 1 Month Subscription to Price Database (Chemicals only)
  • Complimentary Excel Data Set
  • PPT Version of the Report
  • Power BI Dashboards
  • License Upgrade
  • Free Analyst Hours

Small Business Bundle

Number of Reports: 5

25%

tax inclusive*

  • 5 Reports Included
  • Life Time Acess
  • Analyst Support Related to Report
  • PDF Version of the Report
  • Complimentary Excel Data Set
  • Free Analyst Hours - 50 Hours
  • Free 1 Month Subscription to Trade Data Base
  • 1 Month Subscription to Price Database (Chemicals only)
  • Complimentary Excel Data Set
  • PPT Version of the Report
  • Power BI Dashboards
  • License Upgrade

Growth Bundle

Number of Reports: 8

30%

tax inclusive*

  • 8 Reports Included
  • Life Time Acess
  • Analyst Support Related to Report
  • PDF Version of the Report
  • Complimentary Excel Data Set
  • Free Analyst Hours - 50 Hours
  • Free 1 Month Subscription to Trade Data Base
  • 1 Month Subscription to Price Database (Chemicals only)
  • License Upgrade
  • Free Analyst Hours - 80 Hours
  • Power BI Dashboards

Enterprise Bundle

Number of Reports: 10

35%

tax inclusive*

  • 10 Reports Included
  • Life Time Acess
  • Analyst Support Related to Report
  • PDF Version of the Report
  • Complimentary Excel Data Set
  • Free Analyst Hours - 50 Hours
  • Free 1 Month Subscription to Trade Data Base
  • 1 Month Subscription to Price Database (Chemicals only)
  • License Upgrade
  • Power BI Dashboards
  • Free Analyst Hours - 100 Hours

How To Order

Our step-by-step guide will help you select, purchase, and access your reports swiftly, ensuring you get the information that drives your decisions, right when you need it.

Select License Type

Choose the right license for your needs and access rights.

Click on ‘Buy Now’

Add the report to your cart with one click and proceed to register.

Select Mode of Payment

Choose a payment option for a secure checkout. You will be redirected accordingly.

Strategic Solutions for Informed Decision-Making

Connect For More Information

Our expert team of analysts will offer full support and resolve any queries regarding the report, before and after the purchase.

Our expert team of analysts will offer full support and resolve any queries regarding the report, before and after the purchase.

We employ meticulous research methods, blending advanced analytics and expert insights to deliver accurate, actionable industry intelligence, staying ahead of competitors.

Our skilled analysts offer unparalleled competitive advantage with detailed insights on current and emerging markets, ensuring your strategic edge.

We offer an in-depth yet simplified presentation of industry insights and analysis to meet your specific requirements effectively.

We’re here to help answer any questions about our products and services.

Contact us

Our Offices


Australia

63 Fiona Drive, Tamworth, NSW

+61-448-061-727

India

C130 Sector 2 Noida, Uttar Pradesh 201301

+91-723-689-1189

Philippines

40th Floor, PBCom Tower, 6795 Ayala Avenue Cor V.A Rufino St. Makati City,1226.

+63-287-899-028, +63-967-048-3306

United Kingdom

6 Gardner Place, Becketts Close, Feltham TW14 0BX, Greater London

+44-753-713-2163

United States

30 North Gould Street, Sheridan, WY 82801

+1-415-325-5166

Vietnam

193/26/4 St.no.6, Ward Binh Hung Hoa, Binh Tan District, Ho Chi Minh City

+84-865-399-124

30 North Gould Street, Sheridan, WY 82801

+1-415-325-5166

63 Fiona Drive, Tamworth, NSW

+61-448-061-727

C130 Sector 2 Noida, Uttar Pradesh 201301

+91-723-689-1189

40th Floor, PBCom Tower, 6795 Ayala Avenue Cor V.A Rufino St. Makati City, 1226.

+63-287-899-028, +63-967-048-3306

6 Gardner Place, Becketts Close, Feltham TW14 0BX, Greater London

+44-753-713-2163

193/26/4 St.no.6, Ward Binh Hung Hoa, Binh Tan District, Ho Chi Minh City

+84-865-399-124