

Consumer Insights
Uncover trends and behaviors shaping consumer choices today
Procurement Insights
Optimize your sourcing strategy with key market data
Industry Stats
Stay ahead with the latest trends and market analysis.

The Asia Pacific cider market reached approximately USD 1.46 Billion in 2025. The market is projected to grow at a CAGR of 4.60% between 2026 and 2035, reaching a value of around USD 2.29 Billion by 2035.
Base Year
Historical Period
Forecast Period
In 2020, approximately 4.9 million individuals aged 26 years and older in Asia, representing 37.2% of that demographic, were reported to have consumed alcohol.
China leads the world in apple production, yielding an impressive 44.4 million tons annually.
Women and students are the primary consumers of cider in China, largely due to its relatively low alcohol content.
Compound Annual Growth Rate
4.6%
Value in USD Billion
2026-2035
*this image is indicative*
| Asia-Pacific Cider Market Report Summary | Description | Value |
| Base Year | USD Billion | 2025 |
| Historical Period | USD Billion | 2019-2025 |
| Forecast Period | USD Billion | 2026-2035 |
| Market Size 2025 | USD Billion | 1.46 |
| Market Size 2035 | USD Billion | 2.29 |
| CAGR 2019-2025 | Percentage | XX% |
| CAGR 2026-2035 | Percentage | 4.60% |
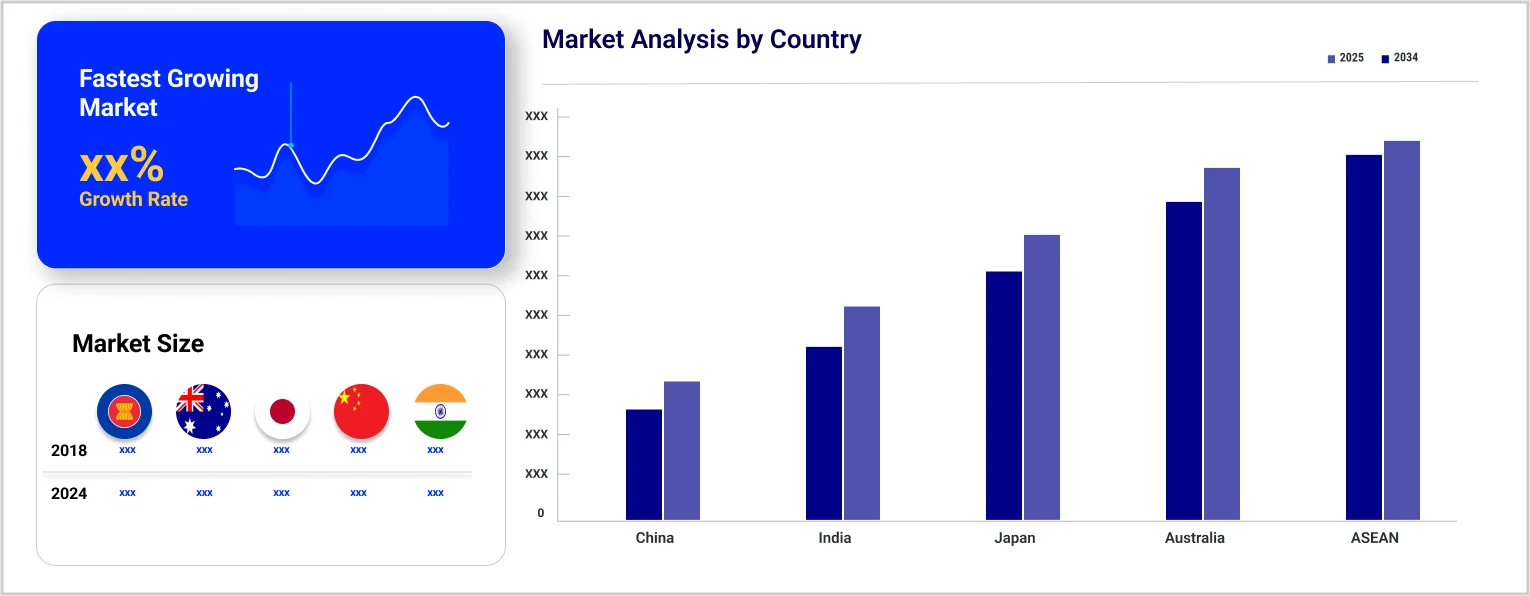
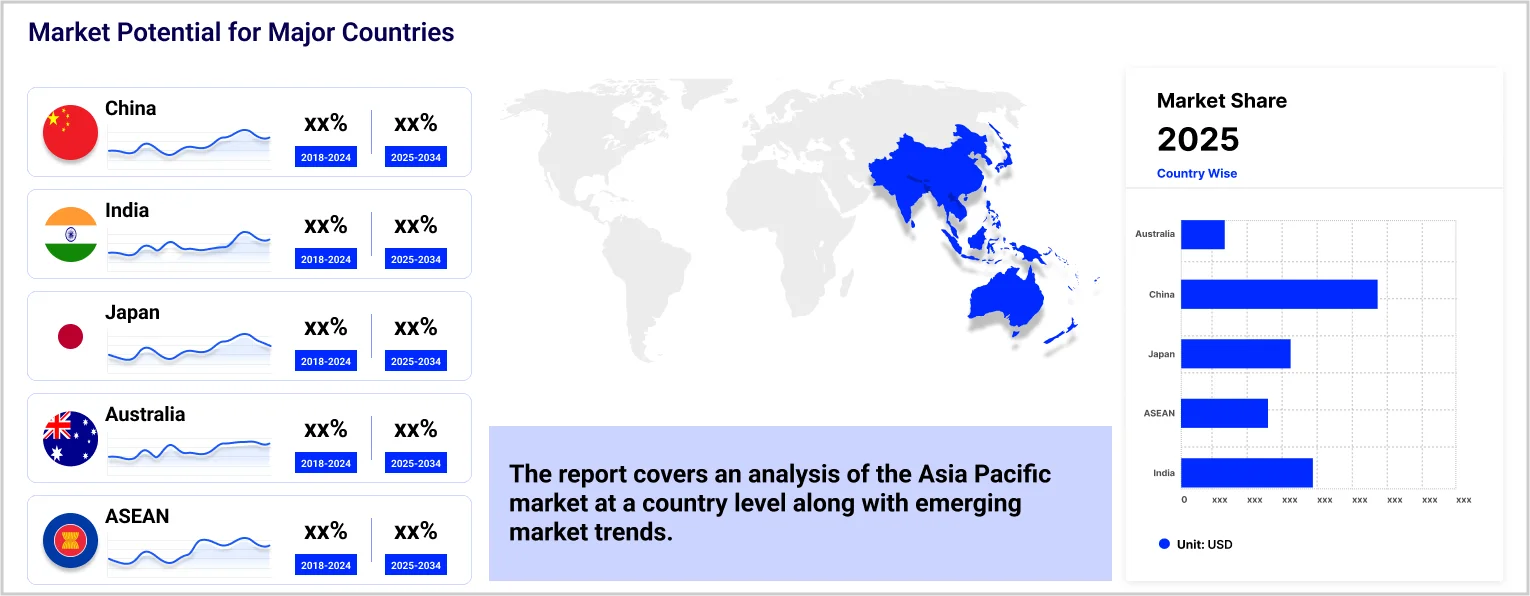
| CAGR 2026-2035 - Market by Country | India | 5.1% |
| CAGR 2026-2035 - Market by Country | China | 4.4% |
| CAGR 2026-2035 - Market by Type | Flavoured | 5.2% |
| CAGR 2026-2035 - Market by Packaging | Cans | 5.3% |
| 2025 Market Share by Country | Australia | 4.7% |
China leads the world in apple production, with its fresh apple output making up 53.20% of the global total as of 2020. While apple farming in China takes place in various locations, the majority of production is concentrated in regions such as the Bohai Bay and Loess Plateau. Despite smallholders running most apple orchards, these two areas alone contribute to 80% of the country's growing area and 90% of its production. Furthermore, India is also a significant player in apple production, particularly in regions like Himachal Pradesh and Jammu and Kashmir. The country alone produced 2,276 tonnes of apples in 2021.
The economic expansion in numerous Asian nations has resulted in a rise in disposable income, enabling consumers to allocate more funds towards beverages, such as premium and imported selections. In the first quarter of 2024, China's per capita disposable income reached 11,539 yuan ($1,624.57), marking a 6.2 per cent increase compared to the previous year in nominal terms, as reported by the National Bureau of Statistics. With the growth in disposable incomes, consumers now possess greater financial freedom to invest in non-essential products, including alcoholic beverages like cider.
The Minami-Shinshu region in southern Nagano Prefecture, Japan, is renowned for its numerous apple orchards and is considered a key hub for cider production in the country. In 2020, five local cider producers in the area initiated a collaborative effort with cider makers from Australia, Denmark, Norway, Spain, and the United States. This joint project, known as Global Cider Connect, aims to enhance the quality of its cider products through innovation and international partnerships.

“Asia Pacific Cider Market Report and Forecast 2026-2035” offers a detailed analysis of the market based on the following segments:
Market Breakup by Type
Market Breakup by Packaging
Market Breakup by Distribution Channel
Market Breakup by Country
| CAGR 2026-2035 - Market by | Country |
| India | 5.1% |
| China | 4.4% |
| Japan | XX% |
| ASEAN | XX% |
| Australia | XX% |
| Others | XX% |
Based on the type, the market is segmented into flavoured and plain. The flavoured segment is projected to grow at a CAGR of 5.2% during the forecast period of 2026-2035. Flavoured ciders come in a wide range of options, including fruit flavours like berry, cherry, pear, and exotic flavours like ginger and cinnamon. This variety appeals to a broad audience, allowing consumers to explore different taste profiles beyond traditional apple cider.
Major players are focusing on flavour innovation, premiumisation, and ethical sourcing to gain a competitive edge in the market.


Upto 15% Off
USD
$2499 $2249
$3999 $3599
$4999 $4249
$5999 $5099


*While we strive to always give you current and accurate information, the numbers depicted on the website are indicative and may differ from the actual numbers in the main report. At Expert Market Research, we aim to bring you the latest insights and trends in the market. Using our analyses and forecasts, stakeholders can understand the market dynamics, navigate challenges, and capitalize on opportunities to make data-driven strategic decisions.*
Get in touch with us for a customized solution tailored to your unique requirements and save upto 35%!
In 2025, the market reached an approximate value of USD 1.46 Billion.
The market is estimated to grow at a CAGR of 4.60% between 2026 and 2035.
The market is estimated to witness a healthy growth during 2026-2035 to reach around USD 2.29 Billion by 2035.
The market is being driven by rising disposable income, an increase in alcohol consumption, and growing apple production.
The key trends aiding the market expansion include the rise in cider tourism, the sourcing of organically produced apples, and the growing popularity of craft ciders.
The major countries considered in the market are China, Japan, India, ASEAN, and Australia, among others.
The major distribution channels for cider in the market include on-trade and off-trade.
The major players in the market are Asahi Group Holdings, Ltd., Carlsberg Group, TRILLIUM BEVERAGES PVT. LTD., Siqera, Heineken Brouwerijen B.V., Barossa Cider Co., William Smith & Sons, THREE OAKS CIDER CO., Small Acres Cyder Pty Ltd., and Kangaroo Island Ciders, among others.
Explore our key highlights of the report and gain a concise overview of key findings, trends, and actionable insights that will empower your strategic decisions.
| REPORT FEATURES | DETAILS |
| Base Year | 2025 |
| Historical Period | 2019-2025 |
| Forecast Period | 2026-2035 |
| Scope of the Report |
Historical and Forecast Trends, Industry Drivers and Constraints, Historical and Forecast Market Analysis by Segment:
|
| Breakup by Type |
|
| Breakup by Packaging |
|
| Breakup by Distribution Channel |
|
| Breakup by Country |
|
| Market Dynamics |
|
| Competitive Landscape |
|
| Companies Covered |
|
Datasheet
One User
USD 2,499
USD 2,249
tax inclusive*
Single User License
One User
USD 3,999
USD 3,599
tax inclusive*
Five User License
Five User
USD 4,999
USD 4,249
tax inclusive*
Corporate License
Unlimited Users
USD 5,999
USD 5,099
tax inclusive*
*Please note that the prices mentioned below are starting prices for each bundle type. Kindly contact our team for further details.*
Flash Bundle
Small Business Bundle
Growth Bundle
Enterprise Bundle
*Please note that the prices mentioned below are starting prices for each bundle type. Kindly contact our team for further details.*
Flash Bundle
Number of Reports: 3
20%
tax inclusive*
Small Business Bundle
Number of Reports: 5
25%
tax inclusive*
Growth Bundle
Number of Reports: 8
30%
tax inclusive*
Enterprise Bundle
Number of Reports: 10
35%
tax inclusive*
How To Order

Select License Type
Choose the right license for your needs and access rights.

Click on ‘Buy Now’
Add the report to your cart with one click and proceed to register.

Select Mode of Payment
Choose a payment option for a secure checkout. You will be redirected accordingly.
Gain insights to stay ahead and seize opportunities.

Get insights & trends for a competitive edge.

Track prices with detailed trend reports.

Analyse trade data for supply chain insights.

Leverage cost reports for smart savings

Enhance supply chain with partnerships.

Connect For More Information
Our expert team of analysts will offer full support and resolve any queries regarding the report, before and after the purchase.
Our expert team of analysts will offer full support and resolve any queries regarding the report, before and after the purchase.
We employ meticulous research methods, blending advanced analytics and expert insights to deliver accurate, actionable industry intelligence, staying ahead of competitors.
Our skilled analysts offer unparalleled competitive advantage with detailed insights on current and emerging markets, ensuring your strategic edge.
We offer an in-depth yet simplified presentation of industry insights and analysis to meet your specific requirements effectively.


Share