

Consumer Insights
Uncover trends and behaviors shaping consumer choices today
Procurement Insights
Optimize your sourcing strategy with key market data
Industry Stats
Stay ahead with the latest trends and market analysis.

The Asia Pacific beer market reached around USD 221.88 Billion in 2025. The market is projected to grow at a CAGR of 3.50% between 2026 and 2035 to reach nearly USD 312.98 Billion by 2035.
Base Year
Historical Period
Forecast Period
The overall consumption of beer in Asia surged by 4.9% y-o-y in 2021.
Beer consumption in China surged by 1.0% y-o-y in 2022.
Japan consumed 34.2 litres of beer in 2021, which is a y-o-y surge of 2.5%.
Compound Annual Growth Rate
3.5%
Value in USD Billion
2026-2035
*this image is indicative*
| Asia Pacific Beer Market Report Summary | Description | Value |
| Base Year | USD Billion | 2025 |
| Historical Period | USD Billion | 2019-2025 |
| Forecast Period | USD Billion | 2026-2035 |
| Market Size 2025 | USD Billion | 221.88 |
| Market Size 2035 | USD Billion | 312.98 |
| CAGR 2019-2025 | Percentage | XX% |
| CAGR 2026-2035 | Percentage | 3.50% |
| CAGR 2026-2035 - Market by Region | India | 4.0% |
| CAGR 2026-2035 - Market by Region | China | 3.6% |
| CAGR 2026-2035 - Market by Product Type | Lager | 3.9% |
| CAGR 2026-2035 - Market by Distribution Channel | On-Trade | 4.1% |
| 2025 Market Share by Country | Japan | 4.3% |
In 2021, beer production in China recorded a year-on-year growth of 5.6%, reaching 3,562.4 kilolitres. China accounts for 12% of global beer sales, with imports recording an 11% surge by volume (and a 13% surge by value) in 2021. While annual beer consumption was 45.7 billion litres, the rising popularity of craft beers, premium products, and foreign brands is expected to fuel the market growth in the forecast period.
It is expected that by 2025, 50% of all beer consumption and 70% of all beer spending can occur at bars, restaurants, and other on-trade channels. Tmall, an online retail platform in China, has reported a 42.5% surge in beer sales volume, while its incomes have risen by 48.2% between 2019 and 2020.
In 2022, Japan consumed nearly 5 billion kilolitres of beer. The per capita consumption of beer reached 34.2 litres (or nearly 54 large bottles), which was a year-on-year increase of 1.5 bottles.
Vietnam is the leading consumer of beer in Southeast Asia and ranks behind China and Japan in Asia. In 2022, beer consumption reached 3.8 billion litres, which constituted 2.2% of the global demand. As per the Institute of Labour Economics, per capita beer consumption has risen over 100% in Vietnam in the past decades. Beer constitutes 91% of the overall sales of alcoholic beverages in Vietnam.

Asia Pacific Beer Market Report and Forecast 2026-2035 offers a detailed analysis of the market based on the following segments:
Market Breakup by Product Type
Market Breakup by Production
Market Breakup by Category
Market Breakup by Alcohol Content
Market Breakup by Distribution Channel
Market Breakup by Country
| CAGR 2026-2035 - Market by | Product Type |
| Lager | 3.9% |
| Ale | 3.7% |
| Stouts | XX% |
| Others | XX% |
| CAGR 2026-2035 - Market by | Distribution Channel |
| On-Trade | 4.1% |
| Off-Trade | XX% |
| CAGR 2026-2035 - Market by | Country |
| India | 4.0% |
| China | 3.6% |
| Japan | XX% |
| ASEAN | XX% |
| Australia | XX% |
| Others | XX% |
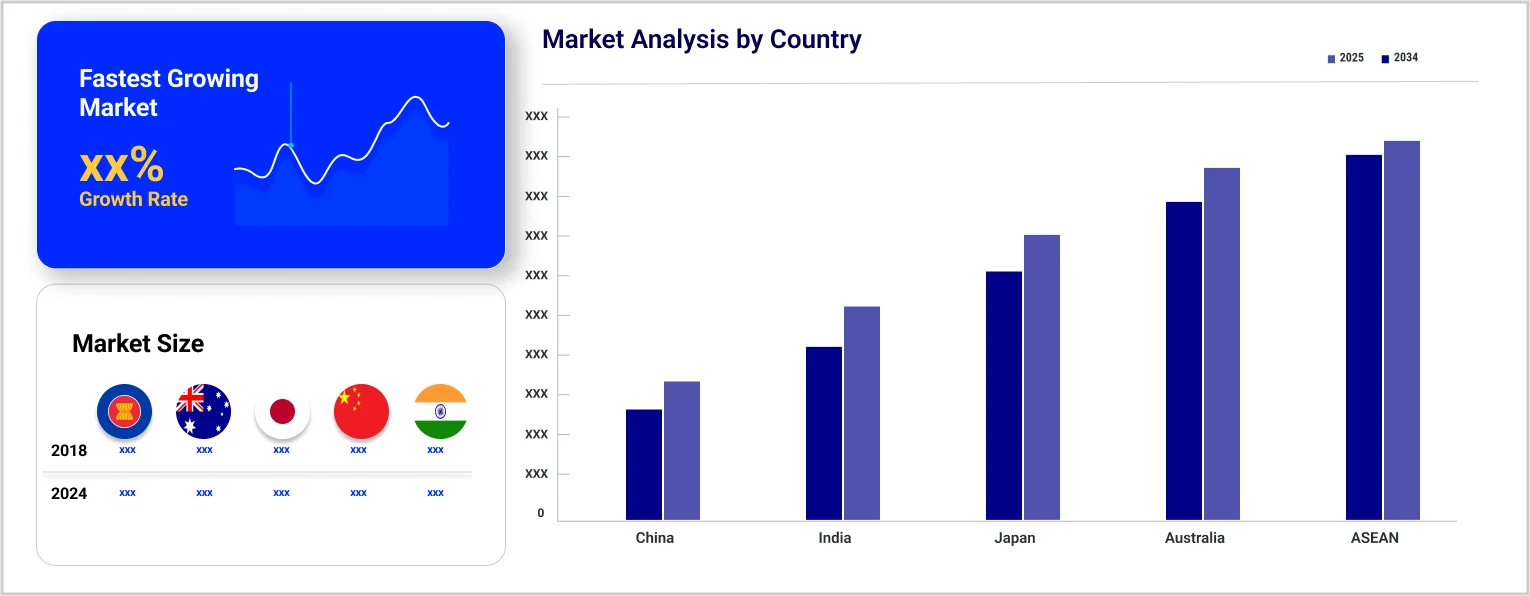
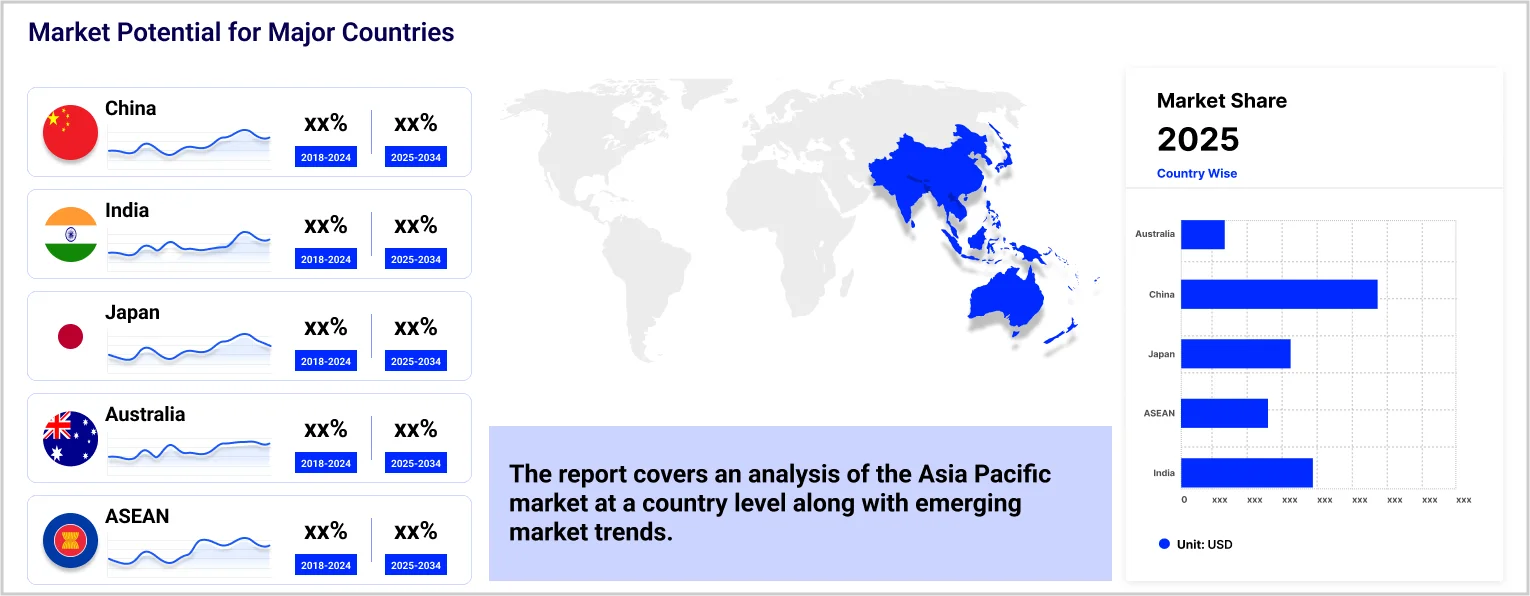
Based on country, the market is segmented into China, Japan, India, ASEAN, and Australia, among others. Over the forecast period, India and China are expected to grow at a CAGR of 4.0% and 3.6% between 2026 and 2035 respectively, due to the proliferation of on-trade centres for beer consumption.
| 2025 Market Share by | Country |
| Japan | 4.3% |
| China | XX% |
| India | XX% |
| ASEAN | XX% |
| Australia | XX% |
| Others | XX% |
Beer companies are adopting corporate social responsibility strategies to promote safe drinking habits among customers.


Upto 15% Off
USD
$2499 $2249
$3999 $3599
$4999 $4249
$5999 $5099


*While we strive to always give you current and accurate information, the numbers depicted on the website are indicative and may differ from the actual numbers in the main report. At Expert Market Research, we aim to bring you the latest insights and trends in the market. Using our analyses and forecasts, stakeholders can understand the market dynamics, navigate challenges, and capitalize on opportunities to make data-driven strategic decisions.*
Get in touch with us for a customized solution tailored to your unique requirements and save upto 35%!
The market reached nearly USD 221.88 Billion in 2025.
The market is projected to grow at a CAGR of 3.50% between 2026 and 2035.
The market is assessed to witness healthy growth in the forecast period to reach around USD 312.98 Billion in 2035.
The different product types in the market are lager, ale, and stouts, among others.
The different distribution channels in the market are on-trade and off-trade.
The different categories of beer in the market include standard beer and premium beer.
The different countries covered in the market report are China, Japan, India, ASEAN, and Australia, among others.
The key market players are Heineken N.V., Anheuser-Busch Inbev S.A., Carlsberg A/S, Asahi Group Holdings, Ltd., Kirin Holdings Co. Ltd., Beijing Yanjing Beer Co., Ltd., United Breweries Ltd., Tsingtao Brewery Co. Ltd., HiteJinro Co., Ltd., and B9 Beverages Private Limited, among others.
Explore our key highlights of the report and gain a concise overview of key findings, trends, and actionable insights that will empower your strategic decisions.
| REPORT FEATURES | DETAILS |
| Base Year | 2025 |
| Historical Period | 2019-2025 |
| Forecast Period | 2026-2035 |
| Scope of the Report |
Historical and Forecast Trends, Industry Drivers and Constraints, Historical and Forecast Market Analysis by Segment:
|
| Breakup by Product Type |
|
| Breakup by Production |
|
| Breakup by Category |
|
| Breakup by Alcohol Content |
|
| Breakup by Distribution Channel |
|
| Breakup by Country |
|
| Market Dynamics |
|
| Competitive Landscape |
|
| Companies Covered |
|
Datasheet
One User
USD 2,499
USD 2,249
tax inclusive*
Single User License
One User
USD 3,999
USD 3,599
tax inclusive*
Five User License
Five User
USD 4,999
USD 4,249
tax inclusive*
Corporate License
Unlimited Users
USD 5,999
USD 5,099
tax inclusive*
*Please note that the prices mentioned below are starting prices for each bundle type. Kindly contact our team for further details.*
Flash Bundle
Small Business Bundle
Growth Bundle
Enterprise Bundle
*Please note that the prices mentioned below are starting prices for each bundle type. Kindly contact our team for further details.*
Flash Bundle
Number of Reports: 3
20%
tax inclusive*
Small Business Bundle
Number of Reports: 5
25%
tax inclusive*
Growth Bundle
Number of Reports: 8
30%
tax inclusive*
Enterprise Bundle
Number of Reports: 10
35%
tax inclusive*
How To Order

Select License Type
Choose the right license for your needs and access rights.

Click on ‘Buy Now’
Add the report to your cart with one click and proceed to register.

Select Mode of Payment
Choose a payment option for a secure checkout. You will be redirected accordingly.
Gain insights to stay ahead and seize opportunities.

Get insights & trends for a competitive edge.

Track prices with detailed trend reports.

Analyse trade data for supply chain insights.

Leverage cost reports for smart savings

Enhance supply chain with partnerships.

Connect For More Information
Our expert team of analysts will offer full support and resolve any queries regarding the report, before and after the purchase.
Our expert team of analysts will offer full support and resolve any queries regarding the report, before and after the purchase.
We employ meticulous research methods, blending advanced analytics and expert insights to deliver accurate, actionable industry intelligence, staying ahead of competitors.
Our skilled analysts offer unparalleled competitive advantage with detailed insights on current and emerging markets, ensuring your strategic edge.
We offer an in-depth yet simplified presentation of industry insights and analysis to meet your specific requirements effectively.


Share