

Consumer Insights
Uncover trends and behaviors shaping consumer choices today
Procurement Insights
Optimize your sourcing strategy with key market data
Industry Stats
Stay ahead with the latest trends and market analysis.
Trending Now


The Asia Pacific aquafeed market size reached a volume of 40.47 Million Tons in 2024. The market is expected to grow at a CAGR of 10.70% in the forecast period of 2025-2034, to reach a volume of around 111.84 Million Tons by 2034.
Base Year
Historical Period
Forecast Period


Value in Million Tons
2025-2034
Asia Pacific Aquafeed Market Outlook
*this image is indicative*
The Asia Pacific aquafeed market is supported by the presence of a large population and growing consumption of seafood. The region currently holds the highest share in the global aquaculture production. Seafood is one of the most popular food items and plays a significant role in the dietary habits in several countries such as China, Thailand, Vietnam, Indonesia, Malaysia, South Korea, and Japan.
The carps segment represents the most popular end-user in the global aquafeed market. Further pellets account for a significant industry share globally owing to its ease of use.
Aquafeed refers to the compounded meals that are prepared to feed different marine species by mixing various raw materials and additives. Such blends are formulated and supplied in compliance with the species' particular requirements and age. Aquafeed plays a vital role in giving the aquatic species normal growth and health. It also helps reduce the effects of stress, enhancing disease tolerance power, and improve immunity.
On the basis of end-use, the Asia Pacific aquafeed market has been segmented into:
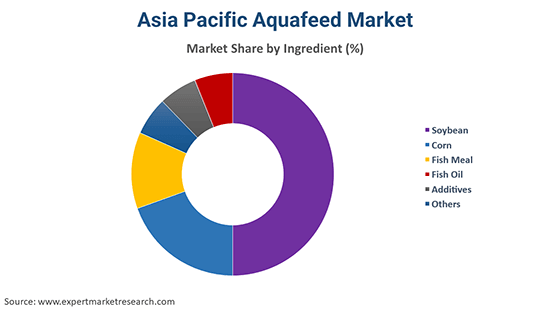
On the basis of ingredients, the industry is categorised into:
Based on additives, the aquafeed market has been segmented into:
On the basis of product form, the industry is categorised into:
On the basis of region, the industry is categorised into:
Read more about this report - REQUEST FREE SAMPLE COPY IN PDF
The growing population and rising health concern among consumers in the Asia Pacific are driving the demand for aquafeed. The growing consumption of seafood is supporting the growth of the Asia Pacific aquafeed market. The growing consumer knowledge regarding the benefits of these additives, coupled with the outbreak of various diseases, is generating the need for additives in poultry, aqua, and other animal-based products, which in turn, is boosting the product demand worldwide. Thus, the demand for seafood in the region is catalysed by both domestic consumption and exports, which is aiding the growth of aquafeed industry in the Asia Pacific.
Within the Asia Pacific, the growing consumer inclination towards protein-rich diet, along with factors like rising disposable incomes and changing lifestyle patterns, is leading to increased demand for seafood. The various government programmes to enhance the supply of certified sustainable seafood will further drive the demand for aquafeed in the region. Moreover, key market players are increasingly investing in R&D activities to deliver improved products, which is expected to accelerate the demand for aquafeed. The market players are also focusing on improving their product lines, which is expected to aid the Asia Pacific aquafeed market over the forecast period.

The report gives a detailed analysis of the following key players in the Asia Pacific aquafeed market, covering their competitive landscape, capacity, and latest developments like mergers, acquisitions, and investments, expansions of capacity, and plant turnarounds:
The comprehensive EMR report provides an in-depth assessment of the market based on the Porter's five forces model along with giving a SWOT analysis.
*While we strive to always give you current and accurate information, the numbers depicted on the website are indicative and may differ from the actual numbers in the main report. At Expert Market Research, we aim to bring you the latest insights and trends in the market. Using our analyses and forecasts, stakeholders can understand the market dynamics, navigate challenges, and capitalize on opportunities to make data-driven strategic decisions.*
Get in touch with us for a customized solution tailored to your unique requirements and save upto 35%!
The Asia Pacific aquafeed market reached a volume of 40.47 Million Tons in 2024.
The market is projected to grow at a CAGR of 10.70% between 2025 and 2034.
The market is assessed to witness a healthy growth in the forecast period of 2025-2034 to reach about 111.84 Million Tons by 2034.
The major drivers of the market include rising disposable incomes, increasing population, rising health concerns among consumers, growing consumption of seafood, and the surging consumer inclination towards protein-rich diets.
The key trends guiding the market are the introduction of favourable government initiatives aimed at improving the supply of sustainable seafood, the growing awareness regarding the benefits of seafood, and the increasing research activities by key players to develop aquafeed with improved nutrition and flavour profile.
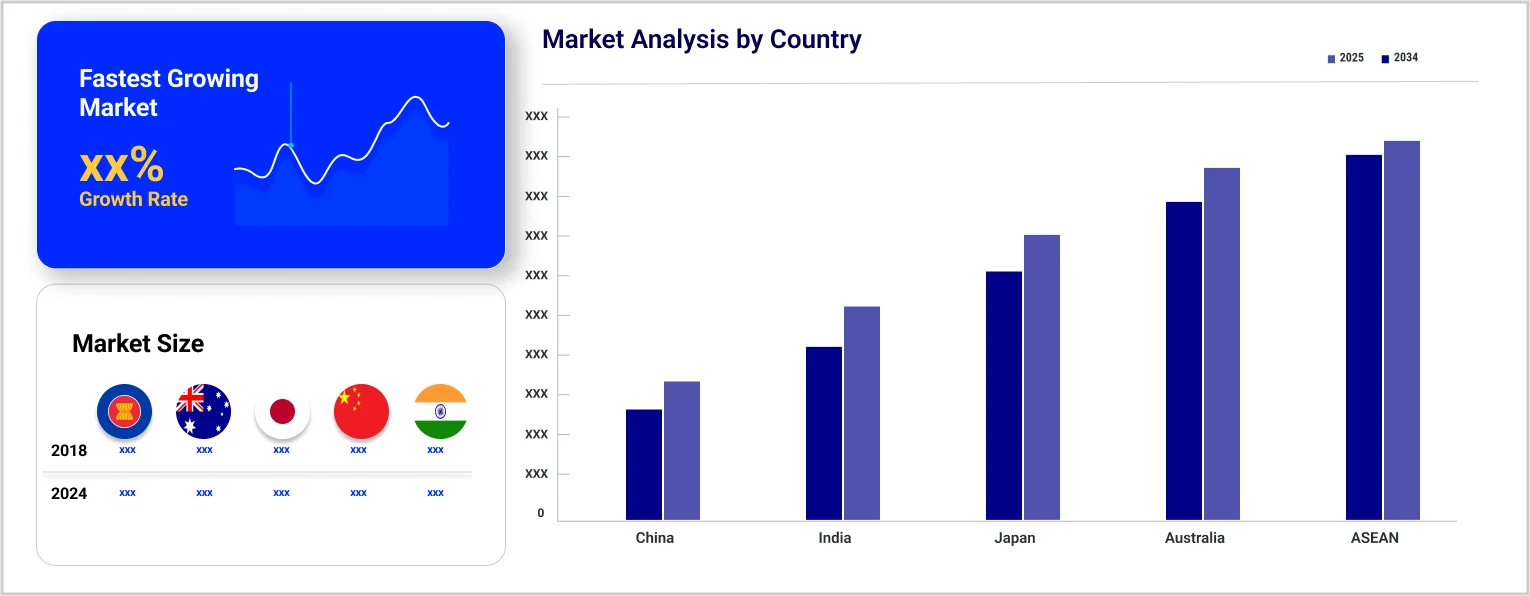
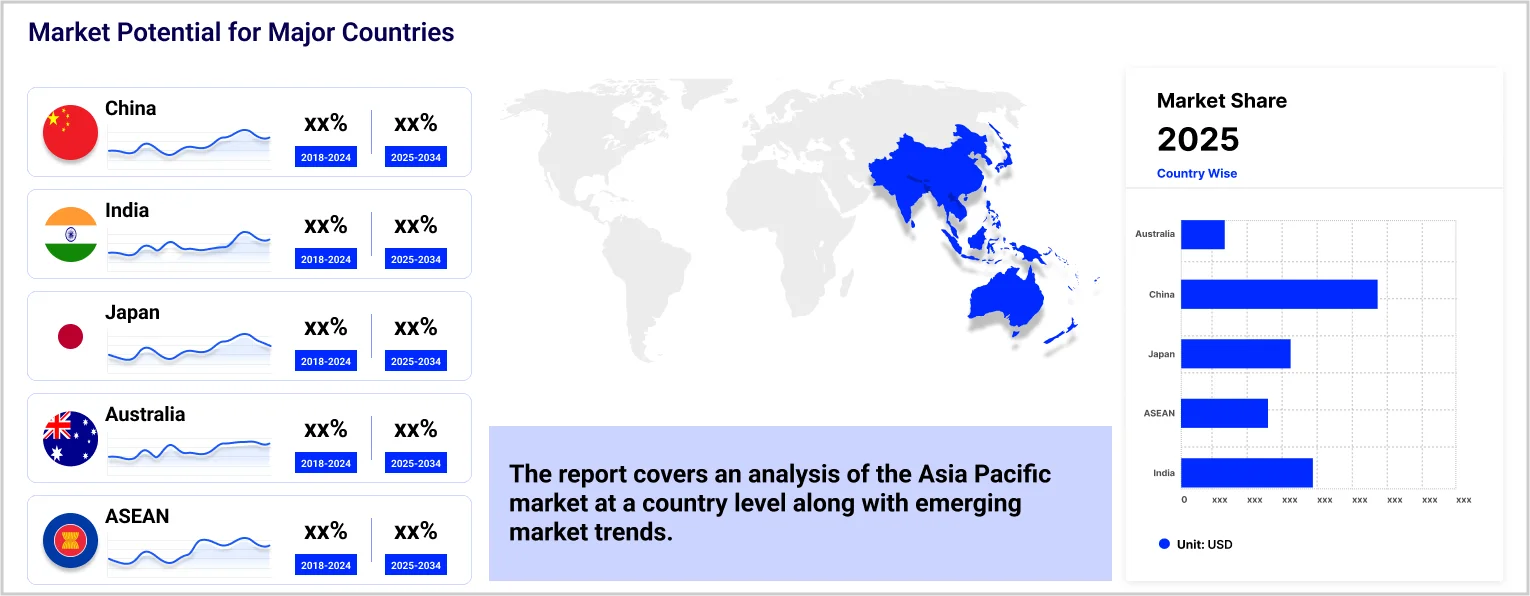
China, Indonesia, Japan, Bangladesh, Thailand, Vietnam, India, Malaysia, and South Korea, among others, are the major countries in the Asia Pacific market.
Fish meal, soybean, fish oil, corn, and additives, among others, are the various ingredients considered in the market report.
The major ingredients in the industry are soybean, fish meal, corn, fish oil, and additives, among others.
The major additives used in the market are amino acids, antibiotics, vitamins, and feed acidifiers, among others.
Pellets, extruded, powdered, and liquid are the various product forms of aquafeed considered in the market report.
Carps, shrimp, tilapia, molluscs, catfish, salmon, and lobsters, among others, are the significant end uses of aquafeed.
The leading players in the market are Charoen Pokphand Foods PCL., BioMar Group, Aller Aqua Group, Ridley Corporation Limited, Cargill, Incorporated, and Nutreco N.V., among others.
Explore our key highlights of the report and gain a concise overview of key findings, trends, and actionable insights that will empower your strategic decisions.
| REPORT FEATURES | DETAILS |
| Base Year | 2024 |
| Historical Period | 2018-2024 |
| Forecast Period | 2025-2034 |
| Scope of the Report |
Historical and Forecast Trends, Industry Drivers and Constraints, Historical and Forecast Market Analysis by Segment:
|
| Breakup by Ingredient |
|
| Breakup by Additives |
|
| Breakup by Product Form |
|
| Breakup by End Use |
|
| Breakup by Country |
|
| Market Dynamics |
|
| Competitive Landscape |
|
| Companies Covered |
|
| Report Price and Purchase Option | Explore our purchase options that are best suited to your resources and industry needs. |
| Delivery Format | Delivered as an attached PDF and Excel through email, with an option of receiving an editable PPT, according to the purchase option. |
Datasheet
One User
USD 2,499
USD 2,249
tax inclusive*
Single User License
One User
USD 3,999
USD 3,599
tax inclusive*
Five User License
Five User
USD 4,999
USD 4,249
tax inclusive*
Corporate License
Unlimited Users
USD 5,999
USD 5,099
tax inclusive*
*Please note that the prices mentioned below are starting prices for each bundle type. Kindly contact our team for further details.*
Flash Bundle
Small Business Bundle
Growth Bundle
Enterprise Bundle
*Please note that the prices mentioned below are starting prices for each bundle type. Kindly contact our team for further details.*
Flash Bundle
Number of Reports: 3
20%
tax inclusive*
Small Business Bundle
Number of Reports: 5
25%
tax inclusive*
Growth Bundle
Number of Reports: 8
30%
tax inclusive*
Enterprise Bundle
Number of Reports: 10
35%
tax inclusive*
How To Order
Our step-by-step guide will help you select, purchase, and access your reports swiftly, ensuring you get the information that drives your decisions, right when you need it.

Select License Type
Choose the right license for your needs and access rights.

Click on ‘Buy Now’
Add the report to your cart with one click and proceed to register.

Select Mode of Payment
Choose a payment option for a secure checkout. You will be redirected accordingly.
Track prices with detailed trend reports.

Analyse trade data for supply chain insights.

Leverage cost reports for smart savings

Enhance supply chain with partnerships.

Gain insights to stay ahead and seize opportunities.

Get insights & trends for a competitive edge.

Track prices with detailed trend reports.
Analyse trade data for supply chain insights.
Leverage cost reports for smart savings
Enhance supply chain with partnerships.
Gain insights to stay ahead and seize opportunities.
Get insights & trends for a competitive edge.
Track prices with detailed trend reports.
Analyse trade data for supply chain insights.
Connect For More Information
Our expert team of analysts will offer full support and resolve any queries regarding the report, before and after the purchase.
Our expert team of analysts will offer full support and resolve any queries regarding the report, before and after the purchase.
We employ meticulous research methods, blending advanced analytics and expert insights to deliver accurate, actionable industry intelligence, staying ahead of competitors.
Our skilled analysts offer unparalleled competitive advantage with detailed insights on current and emerging markets, ensuring your strategic edge.
We offer an in-depth yet simplified presentation of industry insights and analysis to meet your specific requirements effectively.
Australia
63 Fiona Drive, Tamworth, NSW
+61-448-061-727
India
C130 Sector 2 Noida, Uttar Pradesh 201301
+91-723-689-1189
Philippines
40th Floor, PBCom Tower, 6795 Ayala Avenue Cor V.A Rufino St. Makati City,1226.
+63-287-899-028, +63-967-048-3306
United Kingdom
6 Gardner Place, Becketts Close, Feltham TW14 0BX, Greater London
+44-753-713-2163
United States
30 North Gould Street, Sheridan, WY 82801
+1-415-325-5166
Vietnam
193/26/4 St.no.6, Ward Binh Hung Hoa, Binh Tan District, Ho Chi Minh City
+84-865-399-124
United States (Head Office)
30 North Gould Street, Sheridan, WY 82801
+1-415-325-5166
Australia
63 Fiona Drive, Tamworth, NSW
+61-448-061-727
India
C130 Sector 2 Noida, Uttar Pradesh 201301
+91-723-689-1189
Philippines
40th Floor, PBCom Tower, 6795 Ayala Avenue Cor V.A Rufino St. Makati City, 1226.
+63-287-899-028, +63-967-048-3306
United Kingdom
6 Gardner Place, Becketts Close, Feltham TW14 0BX, Greater London
+44-753-713-2163
Vietnam
193/26/4 St.no.6, Ward Binh Hung Hoa, Binh Tan District, Ho Chi Minh City
+84-865-399-124


Share