

Consumer Insights
Uncover trends and behaviors shaping consumer choices today
Procurement Insights
Optimize your sourcing strategy with key market data
Industry Stats
Stay ahead with the latest trends and market analysis.

The Asia Pacific analog semiconductor market size reached around USD 57.26 Billion in 2025. The market is projected to grow at a CAGR of 6.80% between 2026 and 2035 to reach nearly USD 110.55 Billion by 2035. The market growth can be attributed to rapid technological advancements and the growing demand for electric vehicles across the region. Moreover, the rising production of solar power inverters and the expansion of renewable energy projects are favourably influencing the market dynamics.
Base Year
Historical Period
Forecast Period
Consumer electronic devices such as smartphones, smart TVs, and wearables require efficient power management and enhanced audio quality, driving innovation in analog chip design. In FY 2024, smartphone manufacturing in India reached USD 49.27 billion. With countries such as India and China emerging as global manufacturing hubs for consumer electronics, the demand for locally sourced analog semiconductors is surging.
As factories adopt smart manufacturing and Industry 4.0 technologies, the demand for analog components that support motor control, sensor data conversion, and efficient power delivery is rising. Analog chips are essential for maintaining precision and reliability in automated systems. This growing reliance on industrial automation, particularly in China and Southeast Asia, is driving the adoption of advanced analog solutions and propelling the Asia Pacific analog semiconductor market expansion.
Asia Pacific’s commitment to renewable energy is accelerating the need for analog semiconductors in power management and grid stability applications. Countries across the region are heavily investing in solar, wind, and energy storage systems. For instance, Australia invested USD 9 billion in large-scale solar and wind farms in 2024. Analog chips play a crucial role in these technologies by converting and regulating power, ensuring efficiency, and maintaining system reliability.
|
Asia Pacific Analog Semiconductor Market Report Summary |
Description |
Value |
|
Base Year |
USD Billion |
2025 |
|
Historical Period |
USD Billion |
2019-2025 |
|
Forecast Period |
USD Billion |
2026-2035 |
|
Market Size 2025 |
USD Billion |
57.26 |
|
Market Size 2035 |
USD Billion |
110.55 |
|
CAGR 2019-2025 |
Percentage |
XX% |
|
CAGR 2026-2035 |
Percentage |
6.80% |
|
CAGR 2026-2035- Market by Country |
India |
7.8% |
|
CAGR 2026-2035 - Market by Country |
ASEAN |
7.3% |
|
CAGR 2026-2035 - Market by Type |
Application Specific |
7.4% |
|
CAGR 2026-2035 - Market by Components |
Sensors |
7.7% |
|
Market Share by Country 2025 |
Australia |
4.7% |
The increasing adoption of smart manufacturing technologies by Asia Pacific-based organisations is contributing to the market expansion. Over 90% of organisations perceive industrial automation as a crucial part of their future success. This is much higher than organisations based in Europe, Middle East, and Africa (75%) and North America (84%). This is favourably shaping the Asia Pacific analog semiconductor market dynamics. In 2021, the adoption of smart manufacturing solutions surged by 50% worldwide, driven by the rising pressure of product planning and process optimisation to drive business growth. This has further augmented the market growth in the region, as analog semiconductors play a crucial role in power regulation and accurate sensor interfacing.
With the implementation of the 14th FYP for Energy Storage in China, the Asia Pacific analog semiconductor market size is expected to surge. By 2030, the nation aims to become self-sufficient in power generation and storage and boost energy affordability by reducing the per unit cost of energy storage by 30% by the end of 2025. It aims to create 100 GW of battery energy storage capacity by 2030 and nurture the development of sodium-ion, lead-carbon, and novel lithium-ion batteries. Analog semiconductors are extensively used in such power management systems to ensure the effective conversion and distribution of electricity.
Growing demand for electric vehicles; expansion of 5G infrastructure; increasing industrial automation; and rising adoption of renewable energy solutions are the major factors driving the Asia Pacific analog semiconductor market growth.
With Asia Pacific being a major hub for EV manufacturing, the need for analog semiconductors to support power management, battery monitoring, and motor control systems is rapidly increasing. Favourable government incentives and growing consumer adoption of EVs further drive this demand.
The region’s ongoing rollout of 5G networks has led to a surge in demand for analog chips that enable RF amplification, signal filtering, and efficient power conversion. These semiconductors are crucial for maintaining stable connections and high-speed data transmission in 5G base stations and devices. Thus, the development of 5G infrastructure across the region has emerged as one of the Asia Pacific analog semiconductor market trends.
The Asia Pacific manufacturing sector is embracing Industry 4.0 technologies, which rely heavily on analog components for precise sensor interfacing, motor drives, and power regulation. As industries automate further, the demand for robust, reliable analog semiconductors continues to grow.
Countries in the region are expanding renewable energy projects, including solar and wind farms. Analog semiconductors are vital for power inverters, energy storage systems, and grid management, ensuring efficient energy conversion and reliable power distribution.

Growing demand for electric vehicles
Over half of all Indian automotive owners residing in Tier I cities plan to take an EV, driven by considerations like cutting-edge technology in-vehicle, better performance, and technology-enabled safety. This has led to an increased demand for analog semiconductors from EV manufacturing companies to create reliable battery systems and sophisticated automotive designs. Rising consumer concerns surrounding electric vehicle fires are also expected to favourably shape the Indian market, thereby influencing the Asia Pacific analog semiconductor market dynamics favourably in the coming years.
Expansion of 5G infrastructure
5G was initially launched in India on October 1, 2022. Over time, the government has successfully installed over 4.6 lakh 5G Base Transceiver Stations (BTSs) to enhance people’s accessibility to 5G services at cost-effective rates. As of December 2024, 5G services can be accessed by individuals in 779 (out of 783) districts across the country. This is expected to sustain the demand for analog semiconductors in the coming years.
The EMR’s report titled “Asia Pacific Analog Semiconductor Market Report and Forecast 2026-2035” offers a detailed analysis of the market based on the following segments:
Breakup by Type
Breakup by Components
Breakup by Form Factor
Breakup by End Use
Breakup by Country
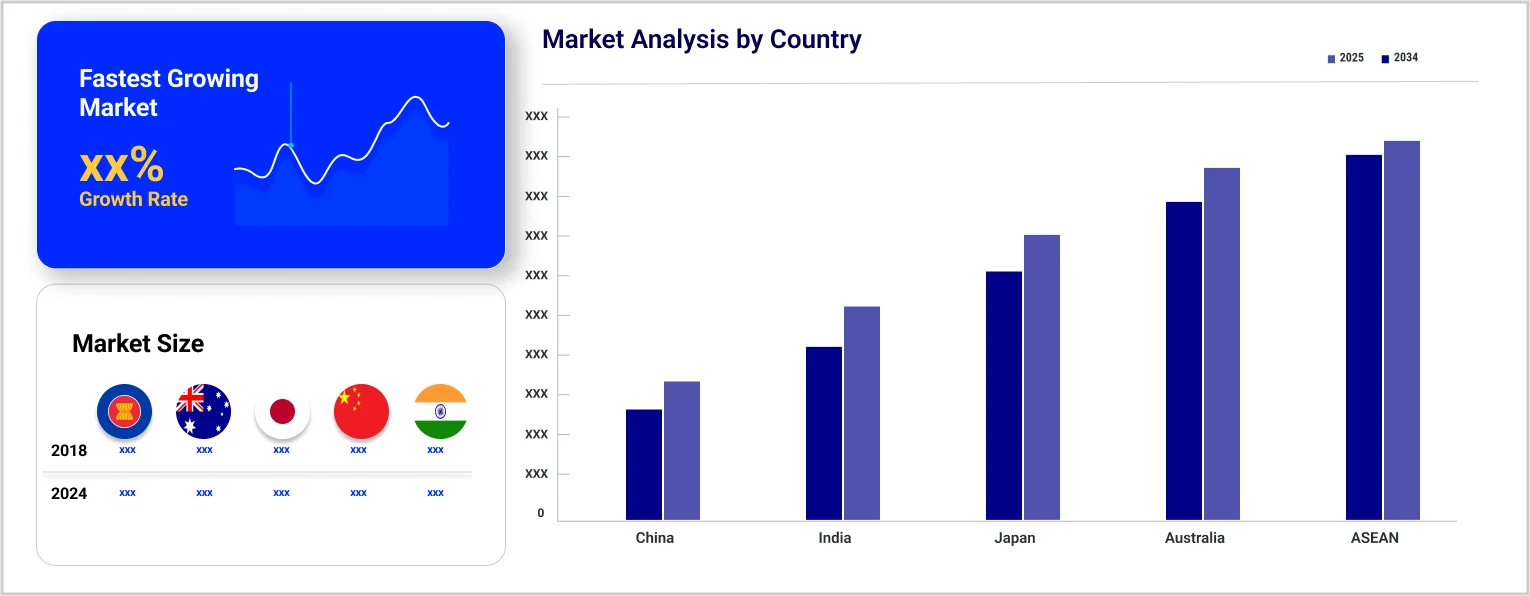
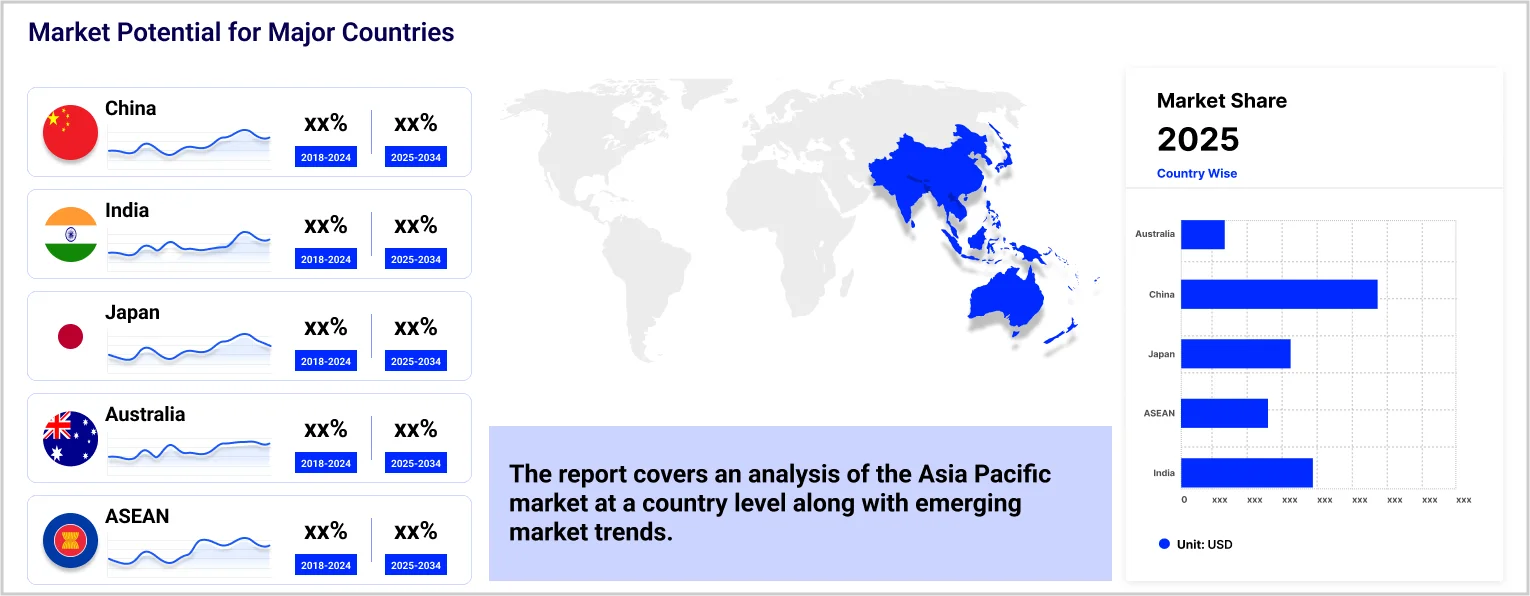
Based on country, the market is segmented into India, China, Japan, ASEAN, and Australia, among others. Over the forecast period of 2026-2035, India is expected to grow at a CAGR of 7.8% due to the growing adoption of electric vehicles, the increasing indigenous manufacturing of consumer electronics such as laptops, wearables, and smartphones, and favourable government initiatives aimed at encouraging local manufacturing of semiconductors.
As per the Asia Pacific analog semiconductor market analysis, the ASEAN region, meanwhile, is estimated to grow at a CAGR of 7.3% between 2026 and 2035 amid the expansion of telecommunication infrastructure, increasing adoption of renewable energy sources, and the growing trend of Industry 4.0.
|
CAGR 2026-2035 - Market by |
Country |
|
India |
7.8% |
|
ASEAN |
7.3% |
|
China |
XX% |
|
Australia |
XX% |
|
Japan |
XX% |
|
Others |
XX% |
Major companies are focusing on expanding their Asia Pacific analog semiconductor market share by investing in local manufacturing facilities and research centres. They are creating innovative analog semiconductors tailored for key regional growth areas, such as electric vehicles, renewable energy, and industrial automation. By collaborating with regional manufacturers and aligning with government initiatives, these players are driving advancements in power management, energy efficiency, and sensor technologies, thereby driving the market growth.
Microchip Technology Inc. was founded in 1987 and is headquartered in Arizona, United States. It is a semiconductor manufacturing company that serves over 125,000 customers across various industrial segments, including automotive, consumer goods, communications, and aerospace and defence, among others.
Skyworks Solutions Inc. was founded in 1962 and is headquartered in California, United States. It specialises in producing RF/analog semiconductors and other high performance engineering solutions.
Qorvo Inc. was founded in 1991 and is headquartered in North Carolina, United States. It specialises in developing power amplifiers, antenna control solutions, antenna switch modules, and power management ICs, among other products.
Texas Instruments Inc. was founded in 1930 and is headquartered in Texas, United States. It specialises in producing microcontrollers, power management solutions, and analog semiconductors, among other items.
*Please note that this is only a partial list; the complete list of key players is available in the full report. Additionally, the list of key players can be customized to better suit your needs.*
Other players included in the Asia Pacific analog semiconductor market report are Infineon Technologies AG, Analog Devices, Inc., NXP Semiconductors NV, ON Semiconductor Corp., Renesas Electronics Corp., and MediaTek Inc., among others.


Upto 15% Off
USD
$2499 $2249
$3999 $3599
$4999 $4249
$5999 $5099


*While we strive to always give you current and accurate information, the numbers depicted on the website are indicative and may differ from the actual numbers in the main report. At Expert Market Research, we aim to bring you the latest insights and trends in the market. Using our analyses and forecasts, stakeholders can understand the market dynamics, navigate challenges, and capitalize on opportunities to make data-driven strategic decisions.*
Get in touch with us for a customized solution tailored to your unique requirements and save upto 35%!
In 2025, the market reached an approximate value of USD 57.26 Billion.
The market is projected to grow at a CAGR of 6.80% between 2026 and 2035.
The market is estimated to witness healthy growth in the forecast period of 2026-2035 to reach a value of around USD 110.55 Billion by 2035.
The different countries considered in the market report include China, Japan, India, ASEAN, and Australia, among others.
The different types of analog semiconductors are general purpose and application specific.
The different components of analog semiconductors are data converters, amplifiers, power management ICs, interface ICs, and sensors, among others.
The different end uses of analog semiconductors are aerospace and defence, automotive, consumer electronics, healthcare, and industrial, among others.
Key players in the market are Infineon Technologies AG, Analog Devices, Inc., Microchip Technology Inc., NXP Semiconductors NV, Texas Instruments Inc., ON Semiconductor Corp., Skyworks Solutions Inc., Renesas Electronics Corp., Qorvo Inc., and MediaTek Inc., among others.
Explore our key highlights of the report and gain a concise overview of key findings, trends, and actionable insights that will empower your strategic decisions.
| REPORT FEATURES | DETAILS |
| Base Year | 2025 |
| Historical Period | 2019-2025 |
| Forecast Period | 2026-2035 |
| Scope of the Report |
Historical and Forecast Trends, Industry Drivers and Constraints, Historical and Forecast Market Analysis by Segment:
|
| Breakup by Type |
|
| Breakup by Components |
|
| Breakup by Form Factor |
|
| Breakup by End Use |
|
| Breakup by Region |
|
| Market Dynamics |
|
| Competitive Landscape |
|
| Companies Covered |
|
Datasheet
One User
USD 2,499
USD 2,249
tax inclusive*
Single User License
One User
USD 3,999
USD 3,599
tax inclusive*
Five User License
Five User
USD 4,999
USD 4,249
tax inclusive*
Corporate License
Unlimited Users
USD 5,999
USD 5,099
tax inclusive*
*Please note that the prices mentioned below are starting prices for each bundle type. Kindly contact our team for further details.*
Flash Bundle
Small Business Bundle
Growth Bundle
Enterprise Bundle
*Please note that the prices mentioned below are starting prices for each bundle type. Kindly contact our team for further details.*
Flash Bundle
Number of Reports: 3
20%
tax inclusive*
Small Business Bundle
Number of Reports: 5
25%
tax inclusive*
Growth Bundle
Number of Reports: 8
30%
tax inclusive*
Enterprise Bundle
Number of Reports: 10
35%
tax inclusive*
How To Order

Select License Type
Choose the right license for your needs and access rights.

Click on ‘Buy Now’
Add the report to your cart with one click and proceed to register.

Select Mode of Payment
Choose a payment option for a secure checkout. You will be redirected accordingly.
Gain insights to stay ahead and seize opportunities.

Get insights & trends for a competitive edge.

Track prices with detailed trend reports.

Analyse trade data for supply chain insights.

Leverage cost reports for smart savings

Enhance supply chain with partnerships.

Connect For More Information
Our expert team of analysts will offer full support and resolve any queries regarding the report, before and after the purchase.
Our expert team of analysts will offer full support and resolve any queries regarding the report, before and after the purchase.
We employ meticulous research methods, blending advanced analytics and expert insights to deliver accurate, actionable industry intelligence, staying ahead of competitors.
Our skilled analysts offer unparalleled competitive advantage with detailed insights on current and emerging markets, ensuring your strategic edge.
We offer an in-depth yet simplified presentation of industry insights and analysis to meet your specific requirements effectively.


Share