

Consumer Insights
Uncover trends and behaviors shaping consumer choices today
Procurement Insights
Optimize your sourcing strategy with key market data
Industry Stats
Stay ahead with the latest trends and market analysis.

The Asia Pacific agricultural tractors market was valued at USD 80.78 Billion in 2025. The industry is expected to grow at a CAGR of 3.50% during the forecast period of 2026-2035 to attain a valuation of USD 113.95 Billion by 2035.
Base Year
Historical Period
Forecast Period
The Agriculture Infrastructure Fund (AIF) surpassed Rs. 30,000 crores in fund mobilization for agricultural projects as of January 2023.
In March 2024, Japanese agricultural equipment builder ‘Kubota’ announced that they are considering the idea of making in-house batteries for the electric versions of their farm equipment, due to the rising demand.
According to industry reports from January 2024, ‘John Deere’, an American company that manufactures agricultural machinery, expects to launch autonomous battery-powered electric tractors in Australia in the year 2026.
Compound Annual Growth Rate
3.5%
Value in USD Billion
2026-2035
*this image is indicative*
The large areas of agricultural land and integration of advanced features such as GPS tracking into tractors propels the market growth. According to the World Bank, 60.05% of India's land area was used for agriculture in 2021. Meanwhile, China's agricultural land was estimated to be 55.46% in 2021. Rising number of tractors are further supporting the market.
Also positively influencing the Asia Pacific agricultural tractors market revenue is the consistent support from the governments. Regional governments are increasingly investing in the agriculture sector in terms of both infrastructure and research and development. In July 2020, India’s Agriculture Infrastructure Fund (AIF) was introduced which aims to provide all-around financial support to farmers, Agri-entrepreneurs, and farmer groups across the country.
Additionally, the market's key competitors are producing new goods in response to the growing demand from developing nations. For example, the third-largest tractor manufacturer, Tractors and Farm Equipment (TAFE), located in Chennai, introduced its new Dynatrack Series in February 2021. This series includes an advanced range of tractors that offers dynamic performance, sophisticated technology, unmatched utility and versatility, all engineered into a single powerful tractor.

Food security concerns, rise in adoption of smart and sustainable technology solutions, as well as growing regional exports are accelerating the Asia Pacific agricultural tractors market value.
The increasing food security concerns due to rising global population will be a major driver of the market. The most populous countries in the world, China and India, are located in the Asia Pacific region, which is home to 60% of the world's population, or 4.3 billion people. As per industry reports, India's growing population, increasing labour costs, and shrinking cultivable land generate a need to mechanize the sector and shift to more efficient ways of farming and cultivating crops.
The market is witnessing a drastic increase in the adoption of tractors with smart technology and farm data management tools. To cater to this demand, leading tractor manufacturers in the region such as New Holland have come up with their best-selling T3.50 tractors powered with the latest technology in precision farming and tools for real-time farm data management, alongside a diverse portfolio of autosteer solutions. Farmers, owners, and operators of TT3.50 tractors will easily track and optimise their machinery fleet and manage operation data from anywhere at any time.
To address the concerns of sustainable agriculture development, countries in the Asia Pacific region are witnessing increased use of electric tractors. The huge demand is being met by industry leaders such as the Silicon Valley-based Monarch Tractors and its development of world’s first fully electric, driver-optional, autonomously operating MK-V tractor range.
The Asia Pacific region is experiencing increased exports of farm tractors owing to new launches from leading manufacturers such as Mahindra and Mahindra. The company, which already has manufacturing bases in India, Japan, and Australia is planning to double its exports by 2027, through entry into major ASEAN markets such as Thailand, Indonesia, and the Philippines with its new lightweight tractor brand Oja.
‘Asia Pacific Agricultural Tractors Market Report and Forecast 2026-2035’ offers a detailed analysis of the market based on the following segments.
Market Breakup by Engine Power
Market Breakup by Type
Market Breakup by Propulsion
Market Breakup by Country
Based on propulsion, electric tractors hold a significant share in the market. A greater focus is being paid by tractor manufacturers to the development of electric tractors as a greener option. Electric tractors are a cost-effective solution with less maintenance needs and offer excellent compliance with changing regulatory demands. This change demonstrates the agricultural sector's dedication to sustainability and is in line with international initiatives to lower carbon emissions and advance environmentally friendly farming technologies.
The market players are increasingly incorporating newer technologies in the manufacturing of tractors to stand out in the market.


Upto 15% Off
USD
$2499 $2249
$3999 $3599
$4999 $4249
$5999 $5099


*While we strive to always give you current and accurate information, the numbers depicted on the website are indicative and may differ from the actual numbers in the main report. At Expert Market Research, we aim to bring you the latest insights and trends in the market. Using our analyses and forecasts, stakeholders can understand the market dynamics, navigate challenges, and capitalize on opportunities to make data-driven strategic decisions.*
Get in touch with us for a customized solution tailored to your unique requirements and save upto 35%!
The Asia Pacific agricultural tractors market will presumably grow at a CAGR of 3.50% between 2026 and 2035.
The key drivers of the market are the large areas of cultivable land, persistent governmental support, and the rising food demand in the region.
A key trend in the market is the growing demand for tractors with higher horsepower to increase efficiency.
Based on type, the segments in the market are orchard tractors, row-crop tractors, and others.
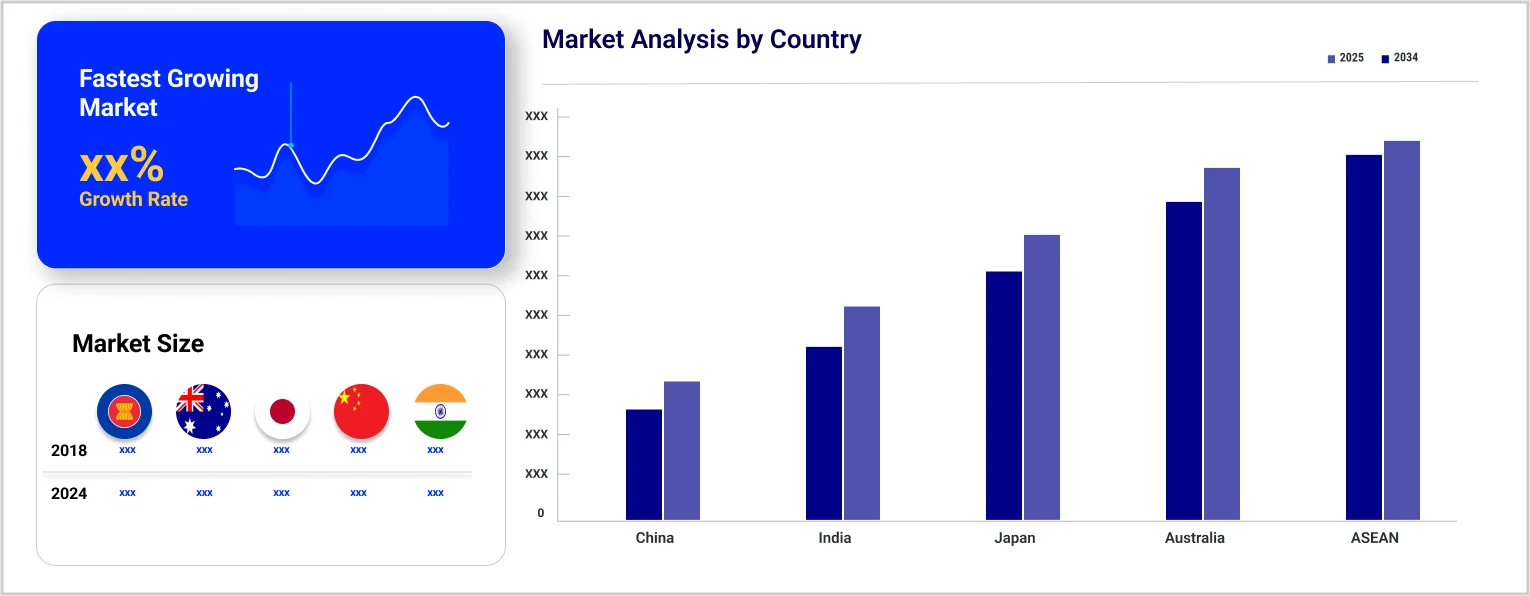
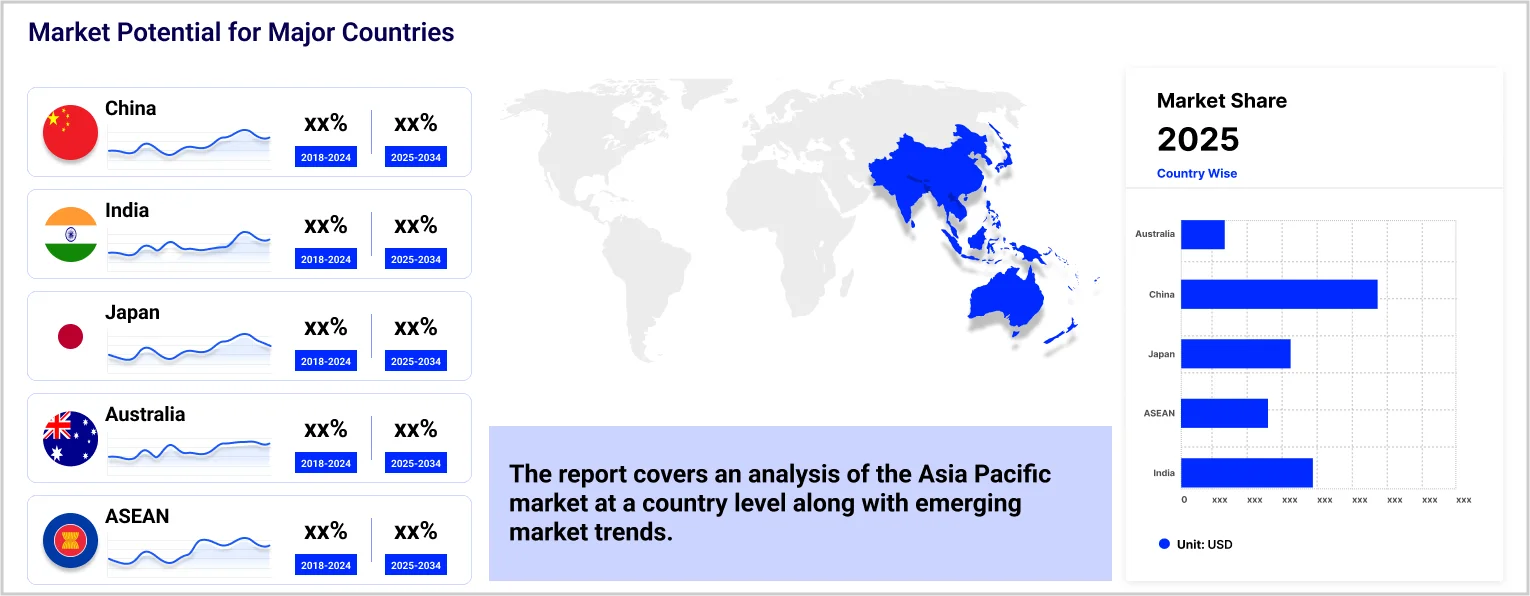
Major countries include China, Japan, India, ASEAN, and Australia, among others.
The key players in the market are Kubota Corp., CLAAS KGaA GmbH, Yanmar Holdings Co., Ltd, CNH Industrial N.V., ISEKI & Co., Ltd, Truong Hai Group Corporation, Mahindra and Mahindra Ltd., AGCO Corp., Deere & Co., Vietnam Engine and Agricultural Machinery Corporation, Tractors and Farm Equipment Limited, and others.
In 2025, the market attained a value of nearly USD 80.78 Billion.
The market is estimated to witness a healthy growth in the forecast period of 2026-2035 to reach about USD 113.95 Billion by 2035.
Explore our key highlights of the report and gain a concise overview of key findings, trends, and actionable insights that will empower your strategic decisions.
| REPORT FEATURES | DETAILS |
| Base Year | 2025 |
| Historical Period | 2019-2025 |
| Forecast Period | 2026-2035 |
| Scope of the Report |
Historical and Forecast Trends, Industry Drivers and Constraints, Historical and Forecast Market Analysis by Segment:
|
| Breakup by Engine Power |
|
| Breakup by Type |
|
| Breakup by Propulsion |
|
| Breakup by Region |
|
| Market Dynamics |
|
| Competitive Landscape |
|
| Companies Covered |
|
Datasheet
One User
USD 2,499
USD 2,249
tax inclusive*
Single User License
One User
USD 3,999
USD 3,599
tax inclusive*
Five User License
Five User
USD 4,999
USD 4,249
tax inclusive*
Corporate License
Unlimited Users
USD 5,999
USD 5,099
tax inclusive*
*Please note that the prices mentioned below are starting prices for each bundle type. Kindly contact our team for further details.*
Flash Bundle
Small Business Bundle
Growth Bundle
Enterprise Bundle
*Please note that the prices mentioned below are starting prices for each bundle type. Kindly contact our team for further details.*
Flash Bundle
Number of Reports: 3
20%
tax inclusive*
Small Business Bundle
Number of Reports: 5
25%
tax inclusive*
Growth Bundle
Number of Reports: 8
30%
tax inclusive*
Enterprise Bundle
Number of Reports: 10
35%
tax inclusive*
How To Order

Select License Type
Choose the right license for your needs and access rights.

Click on ‘Buy Now’
Add the report to your cart with one click and proceed to register.

Select Mode of Payment
Choose a payment option for a secure checkout. You will be redirected accordingly.
Gain insights to stay ahead and seize opportunities.

Get insights & trends for a competitive edge.

Track prices with detailed trend reports.

Analyse trade data for supply chain insights.

Leverage cost reports for smart savings

Enhance supply chain with partnerships.

Connect For More Information
Our expert team of analysts will offer full support and resolve any queries regarding the report, before and after the purchase.
Our expert team of analysts will offer full support and resolve any queries regarding the report, before and after the purchase.
We employ meticulous research methods, blending advanced analytics and expert insights to deliver accurate, actionable industry intelligence, staying ahead of competitors.
Our skilled analysts offer unparalleled competitive advantage with detailed insights on current and emerging markets, ensuring your strategic edge.
We offer an in-depth yet simplified presentation of industry insights and analysis to meet your specific requirements effectively.


Share