

Consumer Insights
Uncover trends and behaviors shaping consumer choices today
Procurement Insights
Optimize your sourcing strategy with key market data
Industry Stats
Stay ahead with the latest trends and market analysis.

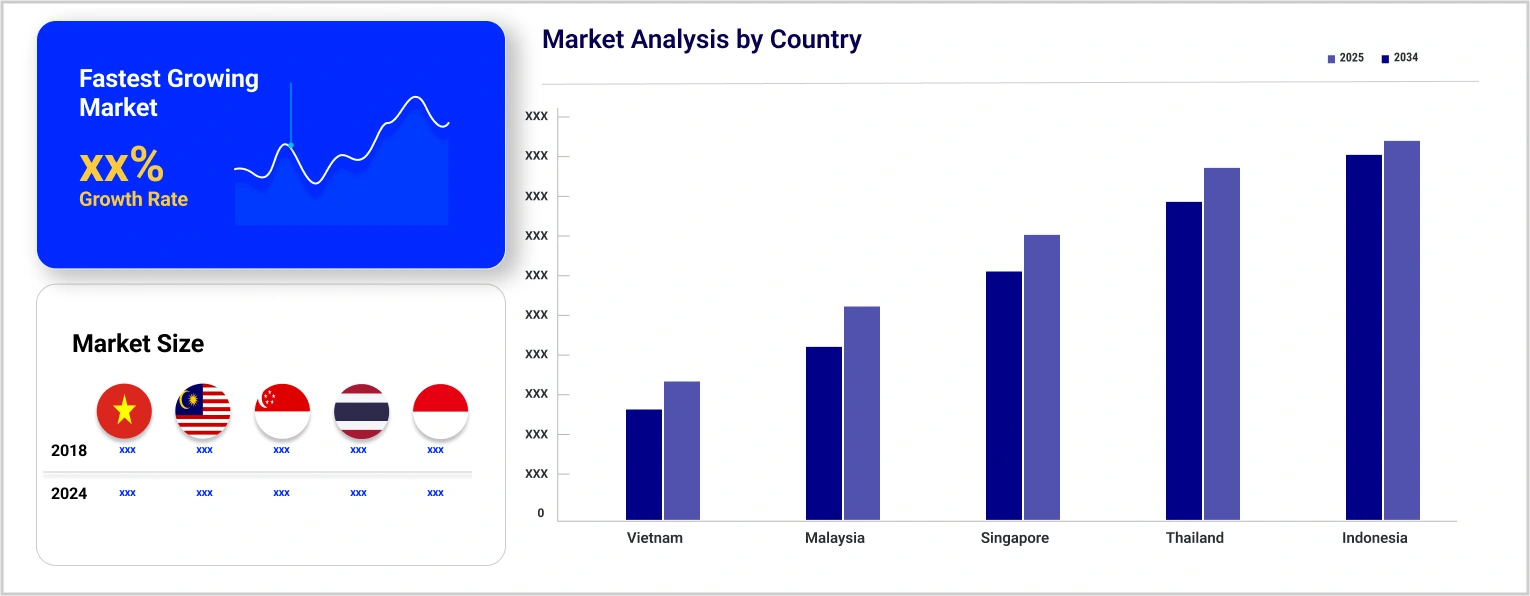
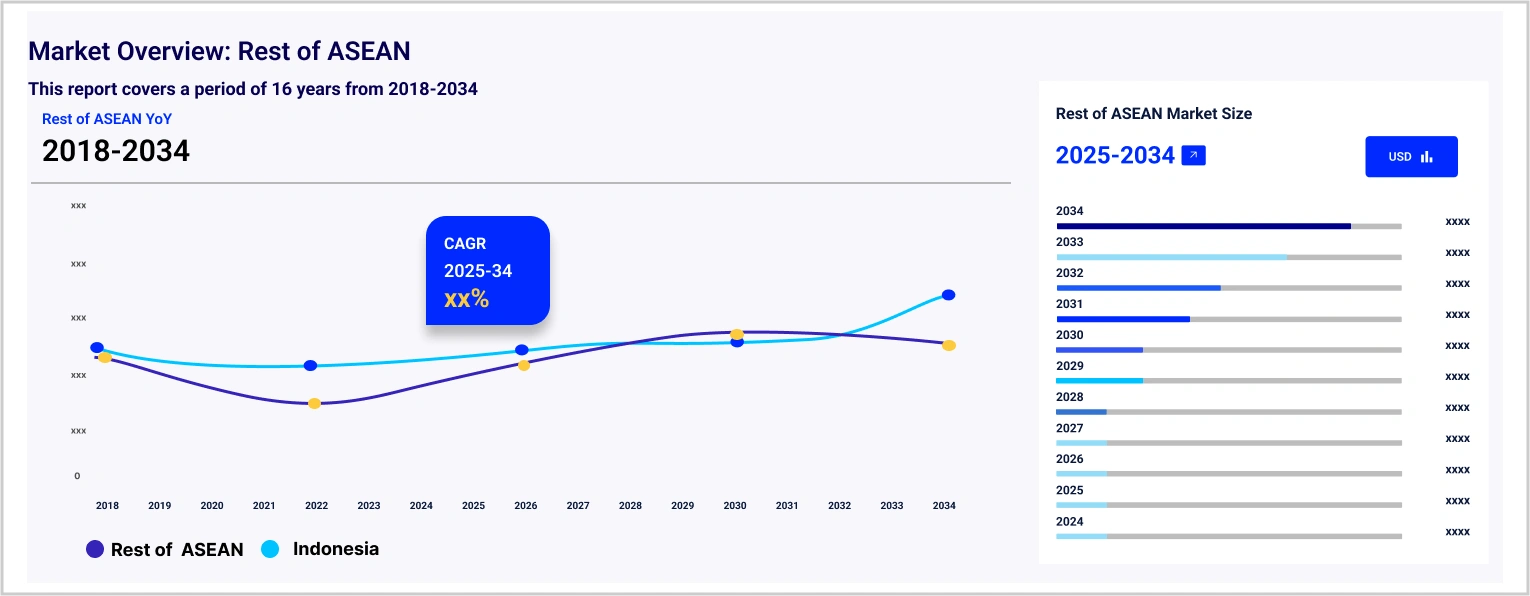
The ASEAN facility management market size reached around USD 36.35 Billion in 2025. The market is projected to grow at a CAGR of 6.70% between 2026 and 2035 to reach nearly USD 69.53 Billion by 2035.
Base Year
Historical Period
Forecast Period
In 2022, the manufacturing industry contributed USD 767 billion or 21.2% of total ASEAN GDP. Economies such as Vietnam and Thailand are experiencing moderate growth, driven by favourable trade agreements and infrastructure developments.
CBRE Group Inc., ISS A/S, and Jones Lang LaSalle Inc. are a few of the major companies in the ASEAN facility management market.
The expansion of infrastructure and construction projects create opportunities for facility management market players.
Compound Annual Growth Rate
6.7%
Value in USD Billion
2026-2035
*this image is indicative*
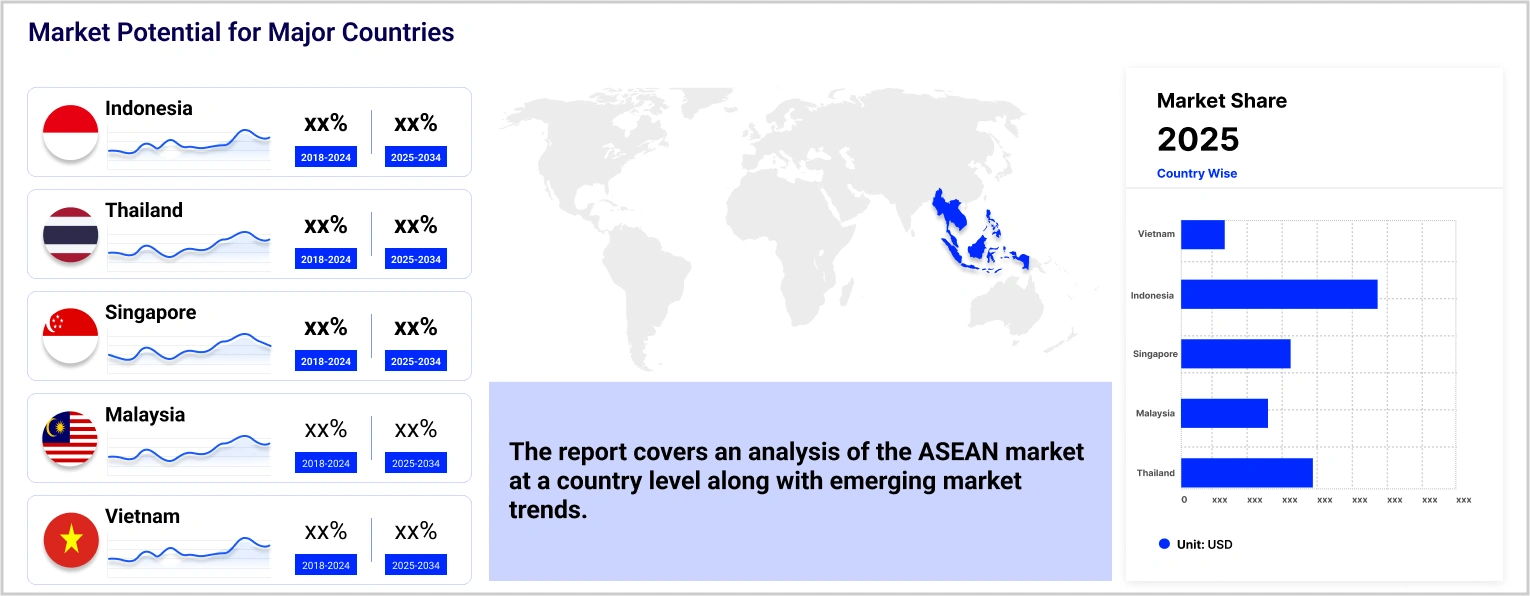
ASEAN nations, such as Malaysia, Vietnam, Thailand, and Indonesia, are increasingly attracting foreign investment due to their lower production costs, relative political stability, and strategic geographic locations. In 2022, Southeast Asia recorded a remarkable net foreign direct investment (FDI) of USD 224 billion, primarily driven by a robust recovery in manufacturing, advancements in digital economies, and enhancements in strategic supply chains. The influx of foreign investment will not only stimulate economic growth but also create substantial opportunities for the ASEAN facility management market through increased demand for services and innovation in service delivery models.
Another factor driving the market growth is the software’s diverse application in end use sectors including construction, energy, and IT and telecom. In the healthcare sector, facility management implements strategies to streamline workflows, reduce energy consumption, and implement cost-effective maintenance practices. The rise in spending on healthcare across the region drives the growth of the market. In 2024, Malaysia’s and Singapore’s healthcare budgets increased by 13.5% and 4.6%, respectively, compared to 2023, accounting for USD 8.7 billion and USD 13.8 billion, respectively. In the education sector, facility management helps in planning, maintenance, and improvement of the physical infrastructure of educational institutions, to provide a safe and conducive learning environment. In 2022, the public expenditure on education as a percentage of GDP in ASEAN countries accounted for 2.8%.
Technological advancements, growing demand for sustainable infrastructure, and rapid expansion of IT and telecommunication sectors are factors boosting the ASEAN facility management market growth.
The adoption of digital technologies compels manufacturing units to alter business models and improve operations, aiding the demand for facility management services, and thus fuelling ASEAN facility management market expansion.
In 2023, medical tourists visiting ASEAN countries accounted for a third of global medical tourists. State-of-the-art medical facilities in the region with Joint Commission International (JCI) accreditation play a key role in attracting foreign patients. In 2023, Malaysia had 16 JCI accredited hospitals.
Facility management services in buildings and commercial structure are crucial to ensure client satisfaction. Government support and a consistent pipeline of public sector construction projects have sustained ASEAN’s construction industry.
The increasing incorporation of sustainability in the construction sector aids the demand for facility management services. In 2023, the Philippines recorded 24 LEED-certified projects, the highest in ASEAN and 10th globally, favouring ASEAN facility management market outlook.
The construction sector in ASEAN countries is poised for continued growth, driven by government initiatives aimed at expanding their economies. Key construction projects in 2024 include Senna Puteri Township Development, Kumbih-3 hydro power project and Pomalaa HPAL Nickel Processing Plant. Significant investments in infrastructure projects, particularly in urban development and transportation connectivity, are thus, expected to play a crucial role in driving the demand for facility management. Moreover, as per industry reports of 2023, Indonesia's and Thailand’s construction sectors grew by 4.9% and 2.9%, respectively.
Furthermore, in the BFSI sector, facility management assists banks in achieving business goals by enhancing operation and maintenance. In 2023, South Asia had around 12.7 commercial bank branches per 100,000 adults, which also impacted ASEAN facility management market revenue. Some of the leading banks in the region include Bank Mandiri, Bank ANZ Indonesia, The Bank of Thailand, and Vietcombank.
Facility management businesses also provide support for the maintenance and operation of information technology (IT) companies. They manage server rooms, data centers, and network equipment to ensure their customers' efficiency. In August 2024, Vantage Data Centres, a global data centre company, officially broke ground on its second facility in Malaysia, located in Cyberjaya. The new data centre, KUL2, will be the largest hyperscale data centre campus in the city, designed to support cloud adoption and AI growth with a total IT capacity of 256MW.
The EMR’s report titled “ASEAN Facility Management Market Report and Forecast 2026-2035” offers a detailed analysis of the market based on the following segments:
Market Breakup by Type
Market Breakup by Sector
Market Breakup by Services
Market Breakup by Industry
Market Breakup by Country
Based on sector, the market is segmented into public and private sector, among others. Facility management is being increasingly adopted by private sector establishments such as property firms, property management companies, construction companies, and hotels. In 2023, number of hotels in Bali, Indonesia were 541, an increase from 507 hotels in 2019, which has positively influenced ASEAN facility management market dynamics.
Moreover, in April 2024, Integrated Facility Solutions (IFS) partnered with SoftBank Robotics Singapore to launch SmartBX Robotics Company Ltd., aiming to enhance integrated facility management in Thailand. This partnership enabled the launch of Whiz Robot to the Thai market, which is an advanced floor cleaning robot designed to transform facility maintenance.
On the other hand, the public sector uses facility management services to ensure the efficiency and reliability of government facilities. As per 2023 data, Indonesia has the presence of approximately 250 District Courts, while Vietnam has 765 first-instance trial courts and 66 appellate courts. Additionally, as per 2022 data, Thailand has 406 public offices.
Major players are increasing their collaboration, partnership, and research and development activities to gain a competitive edge in the in the ASEAN facility management market share.
Headquartered in Texas, United States and founded in 1906, CBRE Group Inc. is a prominent global provider of commercial real estate services, offering a full range of solutions including property management, facilities services, and capital markets expertise. The company also offers integrated facilities management, property management, landlord leasing, fund & property accounting, global workplace solutions, experience services, and occupancy management services.
Headquartered in Soborg, Denmark and founded in 1934, ISS is a global leader in workplace experience and facility management, offering comprehensive solutions that enhance operational efficiency and employee well-being. As per ASEAN facility management market analysis, the company also offers cleaning, technical, workplace, security, and support services.
Headquartered in Illinois, United States and founded in 1999, Jones Lang LaSalle Inc. leverages cutting-edge technology to shape the future of real estate. The company offers comprehensive range of services including portfolio management, integrated facilities management, FM services, engineering services, tech powered solutions, and sustainability services.
Headquartered in Illinois, United States and founded in 1917, Cushman & Wakefield is a global leader in real estate services, offering a wide range of solutions including leasing, capital markets, property management, and investment advisory. The company also offers project and development services, tenant representation, and asset services, among others.
*Please note that this is only a partial list; the complete list of key players is available in the full report. Additionally, the list of key players can be customized to better suit your needs.*
Other players included in the ASEAN facility management market report are Knight Frank LLP and Sodexo, among others.


Upto 15% Off
USD
$2499 $2249
$3999 $3599
$4999 $4249
$5999 $5099


*While we strive to always give you current and accurate information, the numbers depicted on the website are indicative and may differ from the actual numbers in the main report. At Expert Market Research, we aim to bring you the latest insights and trends in the market. Using our analyses and forecasts, stakeholders can understand the market dynamics, navigate challenges, and capitalize on opportunities to make data-driven strategic decisions.*
Get in touch with us for a customized solution tailored to your unique requirements and save upto 35%!
In 2025, the market reached an approximate value of USD 36.35 Billion.
The market is projected to grow at a CAGR of 6.70% between 2026 and 2035.
The market is estimated to witness healthy growth in the forecast period of 2026-2035 to reach a value of around USD 69.53 Billion by 2035.
The major drivers include the expanding manufacturing sector, growth in infrastructure development, and the increasing investment in the IT and telecommunication sector.
Key trends aiding market expansion include the growth in medical tourism specially in countries such as Thailand and Malaysia and expansion of sustainable construction practices, and emergence of LEED certified projects.
The different types of facility management available in the market include out-source and in-house.
Industries included in the market are manufacturing, construction and real estate, healthcare, it and telecom, education, energy and utilities, banking, financial services, and insurance, and military and defence, among others.
The major players in the market include CBRE Group Inc., ISS A/S, Jones Lang LaSalle Inc., Cushman & Wakefield Plc, Knight Frank LLP, and Sodexo, among others.
Explore our key highlights of the report and gain a concise overview of key findings, trends, and actionable insights that will empower your strategic decisions.
| REPORT FEATURES | DETAILS |
| Base Year | 2025 |
| Historical Period | 2019-2025 |
| Forecast Period | 2026-2035 |
| Scope of the Report |
Historical and Forecast Trends, Industry Drivers and Constraints, Historical and Forecast Market Analysis by Segment:
|
| Breakup by Type |
|
| Breakup by Sector |
|
| Breakup by Services |
|
| Breakup by Industry |
|
| Breakup by Region |
|
| Market Dynamics |
|
| Competitive Landscape |
|
| Companies Covered |
|
Datasheet
One User
USD 2,499
USD 2,249
tax inclusive*
Single User License
One User
USD 3,999
USD 3,599
tax inclusive*
Five User License
Five User
USD 4,999
USD 4,249
tax inclusive*
Corporate License
Unlimited Users
USD 5,999
USD 5,099
tax inclusive*
*Please note that the prices mentioned below are starting prices for each bundle type. Kindly contact our team for further details.*
Flash Bundle
Small Business Bundle
Growth Bundle
Enterprise Bundle
*Please note that the prices mentioned below are starting prices for each bundle type. Kindly contact our team for further details.*
Flash Bundle
Number of Reports: 3
20%
tax inclusive*
Small Business Bundle
Number of Reports: 5
25%
tax inclusive*
Growth Bundle
Number of Reports: 8
30%
tax inclusive*
Enterprise Bundle
Number of Reports: 10
35%
tax inclusive*
How To Order

Select License Type
Choose the right license for your needs and access rights.

Click on ‘Buy Now’
Add the report to your cart with one click and proceed to register.

Select Mode of Payment
Choose a payment option for a secure checkout. You will be redirected accordingly.
Gain insights to stay ahead and seize opportunities.

Get insights & trends for a competitive edge.

Track prices with detailed trend reports.

Analyse trade data for supply chain insights.

Leverage cost reports for smart savings

Enhance supply chain with partnerships.

Connect For More Information
Our expert team of analysts will offer full support and resolve any queries regarding the report, before and after the purchase.
Our expert team of analysts will offer full support and resolve any queries regarding the report, before and after the purchase.
We employ meticulous research methods, blending advanced analytics and expert insights to deliver accurate, actionable industry intelligence, staying ahead of competitors.
Our skilled analysts offer unparalleled competitive advantage with detailed insights on current and emerging markets, ensuring your strategic edge.
We offer an in-depth yet simplified presentation of industry insights and analysis to meet your specific requirements effectively.


Share