

Consumer Insights
Uncover trends and behaviors shaping consumer choices today
Procurement Insights
Optimize your sourcing strategy with key market data
Industry Stats
Stay ahead with the latest trends and market analysis.
Trending Now


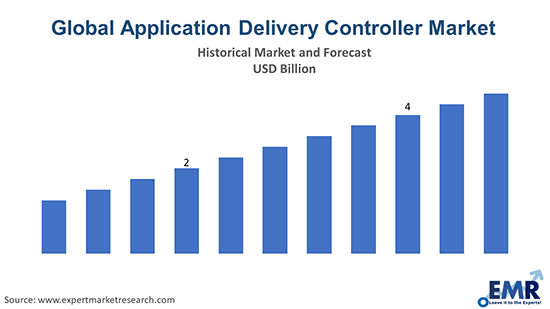
The application delivery controller market is estimated to grow from USD 3.01 billion in 2024 to USD 7.64 billion by 2034 at a CAGR of 10.9% over the 2025-2034 forecast period.
Base Year
Historical Year
Forecast Year


Major market growth drivers include several application delivery controller advantages such as improved performance by spreading traffic across multiple servers, maximizing resources by efficiently allocating application-based traffic, and maintaining the reliability of order and information access.
Read more about this report - REQUEST FREE SAMPLE COPY IN PDF
An application delivery controller is a network system in a data centre, often part of an application delivery network that helps to perform common tasks like those performed by web accelerators to alleviate load from the web servers. Load balancing is also supported. The application delivery controller industry can be divided based on segments like type, enterprise, service, and application.
Market Breakup by Type
Market Breakup by Enterprise
Market Breakup by Service
Market Breakup by Application
Market Breakup by Region
Read more about this report - REQUEST FREE SAMPLE COPY IN PDF
It is expected that the digital application delivery controller segment market will rise during the forecast period at a higher growth rate. Compared to traditional software delivery controllers, it provides a cost-effective alternative with greater control. Countries like Japan, Australia, China, India, and Singapore are supposed to account for a significant industry share in the Asia Pacific. Growing internet traffic, increasing emphasis on virtualization, and the success of using infrastructure as a service solution are the key drivers of industry growth in the Asia Pacific region.


The report presents a detailed analysis of the following key players in the global application delivery controller industry, looking into their capacity, competitive landscape, and latest developments like capacity expansions, plant turnarounds, and mergers and acquisitions:
The EMR report gives an in-depth insight into the industry by providing a SWOT analysis as well as an analysis of Porter's Five Forces model.
*While we strive to always give you current and accurate information, the numbers depicted on the website are indicative and may differ from the actual numbers in the main report. At Expert Market Research, we aim to bring you the latest insights and trends in the market. Using our analyses and forecasts, stakeholders can understand the market dynamics, navigate challenges, and capitalize on opportunities to make data-driven strategic decisions.*
Get in touch with us for a customized solution tailored to your unique requirements and save upto 35%!
In 2024, the global application delivery controller market attained a value of nearly USD 3.01 billion.
The market is projected to grow at a CAGR of 10.9% between 2025 and 2034.
The market is estimated to grow in the forecast period of 2025-2034 to reach about USD 7.64 billion by 2034.
The major drivers of the market are efficient allocation of application-based traffic, growing establishment of data centres, adoption of digital models by various enterprises, and rising demand from developing regions.
The growing technological advancements and increasing virtualisation and internet penetration, are the key trends guiding the growth of the application delivery controller market.
The major regions in the market are North America, Latin America, the Middle East and Africa, Europe, and the Asia Pacific.
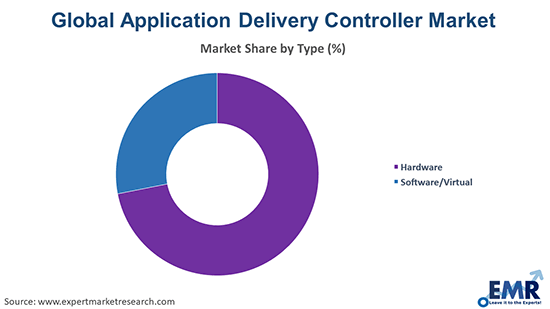
Hardware and software/virtual are the leading application delivery controller types in the market.
By enterprise, the market for application delivery controllers is segmented into small and medium enterprise and large enterprise.
Integration and implementation, and training, support, and maintenance are the significant services of the product in the market.
The major applications of the product include banking finance service, and insurance, retail, IT and telecom, health and life science, energy and utilities, and media and entertainment, among others.
The major players in the market are F5, Inc., Radware Ltd., Citrix Systems, Inc.,Barracuda Networks, Inc., Array Networks, Inc., and A10 Networks, Inc., among others.
Explore our key highlights of the report and gain a concise overview of key findings, trends, and actionable insights that will empower your strategic decisions.
| REPORT FEATURES | DETAILS |
| Base Year | 2024 |
| Historical Period | 2018-2024 |
| Forecast Period | 2025-2034 |
| Scope of the Report |
Historical and Forecast Trends, Industry Drivers and Constraints, Historical and Forecast Market Analysis by Segment:
|
| Breakup by Type |
|
| Breakup by Enterprise |
|
| Breakup by Service |
|
| Breakup by Application |
|
| Breakup by Region |
|
| Market Dynamics |
|
| Competitive Landscape |
|
| Companies Covered |
|
| Report Price and Purchase Option | Explore our purchase options that are best suited to your resources and industry needs. |
| Delivery Format | Delivered as an attached PDF and Excel through email, with an option of receiving an editable PPT, according to the purchase option. |
Single User License
One User
USD 3,999
USD 3,599
tax inclusive*
Datasheet
One User
USD 2,499
USD 2,249
tax inclusive*
Five User License
Five User
USD 4,999
USD 4,249
tax inclusive*
Corporate License
Unlimited Users
USD 5,999
USD 5,099
tax inclusive*
*Please note that the prices mentioned below are starting prices for each bundle type. Kindly contact our team for further details.*
Flash Bundle
Small Business Bundle
Growth Bundle
Enterprise Bundle
*Please note that the prices mentioned below are starting prices for each bundle type. Kindly contact our team for further details.*
Flash Bundle
Number of Reports: 3
20%
tax inclusive*
Small Business Bundle
Number of Reports: 5
25%
tax inclusive*
Growth Bundle
Number of Reports: 8
30%
tax inclusive*
Enterprise Bundle
Number of Reports: 10
35%
tax inclusive*
How To Order
Our step-by-step guide will help you select, purchase, and access your reports swiftly, ensuring you get the information that drives your decisions, right when you need it.

Select License Type
Choose the right license for your needs and access rights.

Click on ‘Buy Now’
Add the report to your cart with one click and proceed to register.

Select Mode of Payment
Choose a payment option for a secure checkout. You will be redirected accordingly.
Gain insights to stay ahead and seize opportunities.

Get insights & trends for a competitive edge.

Track prices with detailed trend reports.

Analyse trade data for supply chain insights.

Leverage cost reports for smart savings

Enhance supply chain with partnerships.

Connect For More Information
Our expert team of analysts will offer full support and resolve any queries regarding the report, before and after the purchase.
Our expert team of analysts will offer full support and resolve any queries regarding the report, before and after the purchase.
We employ meticulous research methods, blending advanced analytics and expert insights to deliver accurate, actionable industry intelligence, staying ahead of competitors.
Our skilled analysts offer unparalleled competitive advantage with detailed insights on current and emerging markets, ensuring your strategic edge.
We offer an in-depth yet simplified presentation of industry insights and analysis to meet your specific requirements effectively.
Australia
63 Fiona Drive, Tamworth, NSW
+61-448-061-727
India
C130 Sector 2 Noida, Uttar Pradesh 201301
+91-723-689-1189
Philippines
40th Floor, PBCom Tower, 6795 Ayala Avenue Cor V.A Rufino St. Makati City,1226.
+63-287-899-028, +63-967-048-3306
United Kingdom
6 Gardner Place, Becketts Close, Feltham TW14 0BX, Greater London
+44-753-713-2163
United States
30 North Gould Street, Sheridan, WY 82801
+1-415-325-5166
Vietnam
193/26/4 St.no.6, Ward Binh Hung Hoa, Binh Tan District, Ho Chi Minh City
+84-865-399-124
United States (Head Office)
30 North Gould Street, Sheridan, WY 82801
+1-415-325-5166
Australia
63 Fiona Drive, Tamworth, NSW
+61-448-061-727
India
C130 Sector 2 Noida, Uttar Pradesh 201301
+91-723-689-1189
Philippines
40th Floor, PBCom Tower, 6795 Ayala Avenue Cor V.A Rufino St. Makati City, 1226.
+63-287-899-028, +63-967-048-3306
United Kingdom
6 Gardner Place, Becketts Close, Feltham TW14 0BX, Greater London
+44-753-713-2163
Vietnam
193/26/4 St.no.6, Ward Binh Hung Hoa, Binh Tan District, Ho Chi Minh City
+84-865-399-124


Share