Explore Our Diverse Range Of Offerings
From detailed reports to experts services offered in 15+ Industry Domains
Report
Press Release
Blogs
Industry Statistics
Add 2 More Reports For 20% off

Report Overview

The global ammonium bicarbonate market is expected to grow at a CAGR of 4.30% in the forecast period of 2025-2034.

2024

Base Year

2018-2024

Historical Year

2025-2034

Forecast Year

Global Ammonium Bicarbonate Market Report Summary Description Value
Base Year USD Million 2024
Historical Period USD Million 2018-2024
Forecast Period USD Million 2025-2034
Market Size 2024 USD Million XX
Market Size 2034 USD Million XX
CAGR 2018-2024 Percentage XX%
CAGR 2025-2034 Percentage 4.30%
CAGR 2025-2034 - Market by Region Asia Pacific 4.9%
CAGR 2025-2034 - Market by Country India 4.6%
CAGR 2025-2034 - Market by Country Brazil 4.1%
CAGR 2025-2034 - Market by Grade Food Grade 4.3%
CAGR 2025-2034 - Market by End Use Food and Beverage 4.9%
Market Share by Country 2023 Germany 5.3%

Ammonium Bicarbonate Market

Read more about this report - REQUEST FREE SAMPLE COPY IN PDF

Ammonium Bicarbonate Market Growth

The Growing Food Industry to Aid the Global Market for Ammonium Bicarbonate

The growing demand for ammonium bicarbonate in the food industry is aiding the growth of the ammonium bicarbonate market. The product is used extensively within the food industry. For example, it is used as a raising agent in the preparations of baked products, like crackers and cookies. The rising demand for such food products in packaged or ready-to-eat formats across both developed as well as emerging economies is boosting the market growth of the product. Furthermore, rapid urbanisation is supporting the growth of the food industry, which, in turn, is enhancing the market for ammonium bicarbonate.

Ammonium Bicarbonate Market Trends

Rising Demand from the End Use Industries to Aid the Global Market Growth for Ammonium Bicarbonate

The ammonium bicarbonate demand is driven by the rising food industry, where it is employed as an active baking agent in the production of baked goods like biscuits, cookies, among others. Further, the growing population and urban development are strengthening the demand for food, which is likely to have a positive impact in the forecast period as well. Moreover, the highest quality standards of the product are also expected to aid the market growth in the forecast period. In addition to this, the product is also finding extensive use in the end-use industries, such as rubber and leather industry, among others. The sustainable growth of these industries is predicted to aid the ammonium bicarbonate industry positively in the forecast period.

CAGR 2025-2034 - Market by Country
India 4.6%
China 4.3%
Brazil 4.1%
USA 3.9%
France 3.7%
Canada XX%
UK 3.4%
Germany XX%
Italy XX%
Japan XX%
Australia XX%
Saudi Arabia XX%
Mexico XX%

However, due to strict regulations and standards associated with the use of chemicals in the food industry, the ammonium bicarbonate industry may find some hindrance over the forecast period.

Recent Developments

As per the recent Indian surveys in 2024, India has witnessed considerable growth in the production of the ammonium bicarbonate grade in the past 5 years. Several companies in the country are investing in modern production facilities that can meet the demand internationally and domestically.

Industry Outlook

According to ITC Trademap, India's ammonia imports decreased from 2,691,051 tons in 2019 to 2,243,843 tons in 2022, followed by a slight rise to 2,336,714 tons in 2023. As per the ammonium bicarbonate industry analysis, the USA's imports showed a gradual decline from 2,510,520 tons in 2019 to 2,177,607 tons in 2023. Morocco's imported 1,587,543 tons in 2019 and 1,885,081 tons in 2022, with a minor decrease to 1,580,275 tons in 2023. South Korea's imports decreased from 1,378,384 tons in 2019 to 1,101,966 tons in 2023.

Turkey saw a drop from 1,024,042 tons in 2019 to 827,985 tons in 2023. China's imports decreased significantly from 1,064,791 tons in 2019 to 235,891 tons in 2022 but then rose to 696,066 tons in 2023 which contributed to the growth of the ammonium bicarbonate industry. France's imports showed a declining trend from 653,896 tons in 2019 to 496,917 tons in 2023.

Saudi Arabia's ammonia exports increased from 6,149,680 tons in 2019 to a peak of 9,541,977 tons in 2020, followed by a decline to 2,417,938 tons in 2023. Indonesia maintained relatively stable export levels, with 1,792,862 tons in 2019 and 1,795,080 tons in 2023. The USA's exports saw a gradual increase from 434,115 tons in 2019 to 1,157,118 tons in 2023. Canada's exports fluctuated, starting at 955,959 tons in 2019, peaking at 1,230,824 tons in 2021, and decreasing to 1,088,736 tons in 2023. Algeria's exports also showed variability, peaking at 1,407,688 tons in 2021 and declining to 853,365 tons in 2023, which influenced the ammonium bicarbonate industry revenue. Oman's exports grew from 84 tons in 2019 to 661,566 tons in 2023. Qatar emerged as a significant exporter with 529,724 tons in 2023.

Global Ammonium Bicarbonate Market by End Use

Read more about this report - REQUEST FREE SAMPLE COPY IN PDF

Ammonium Bicarbonate Industry Segmentations

Ammonium bicarbonate refers to a type of inorganic chemical compound. It is a colourless, crystalline bicarbonate salt of the ammonium ion. The chemical is used as a raising agent in the food industry for the preparation of baked goods like cookies and crackers. It can also be used as a nitrogen fertilizer in the agriculture industry. Besides, it can be used as a constituent in the formulation of fire-extinguisher compounds and in the pharmaceutical industry, as well.

On the basis of grade, the ammonium bicarbonate market is divided into:

  • Food Grade
  • Technical Grade
  • Agriculture Grade

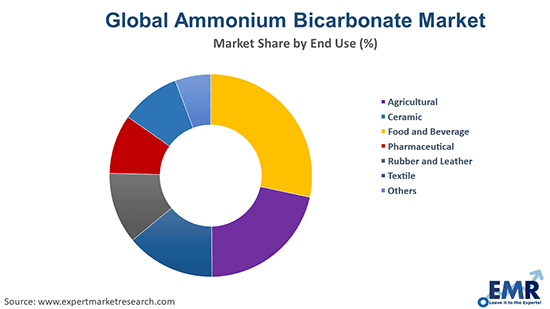
Based on end use, the industry can be segmented into:

  • Agricultural
  • Ceramic
  • Food and Beverage
  • Pharmaceutical
  • Rubber and Leather
  • Textile
  • Others

The regional markets for the product include

  • North America
  • Europe
  • Asia Pacific
  • Latin America
  • Middle East and Africa

CAGR 2025-2034 - Market by Grade
Food Grade 4.3%
Agriculture Grade XX%
Technical Grade XX%
CAGR 2025-2034 - Market by End Use
Food and Beverage 4.9%
Agricultural 4.6%
Pharmaceutical 4.4%
Ceramic XX%
Textile XX%
Others XX%
CAGR 2025-2034 - Market by Region
Asia Pacific 4.9%
Middle East and Africa 4.4%
North America 4.1%
Europe XX%
Latin America XX%
2024 Market Share by Country
Germany 5.3%
USA XX%
Canada XX%
UK XX%

Factors Contributing to the Growth of the Ammonium Bicarbonate Market Globally

  • Rising demand from the food and beverage industry as a leavening agent and pH buffer.
  • Increasing use in agriculture as a nitrogen fertilizer and soil amendment.
  • Growth in the pharmaceutical industry for its use as a reagent and in medicine formulations aids ammonium bicarbonate demand growth.
  • Utilization in the textile industry for dyeing and printing processes.
  • Applications in the rubber and plastic industries as a blowing agent.

Challenges Faced by Manufacturers in the Global Ammonium Bicarbonate Market Share

  • Volatile raw material prices impact production costs and profitability.
  • Stringent environmental regulations and compliance requirements increase operational costs.
  • Competition from alternative leavening agents and fertilizers pressures market share. 
  • Fluctuations in demand from key end-user industries, such as food and agriculture negatively impact ammonium bicarbonate demand forecast.
  • Health and safety concerns related to the handling and storage of ammonium bicarbonate.

Key Indicators of Prices of Ammonium Bicarbonate

Raw Material Costs:

  • Ammonia and Carbon Dioxide: The primary raw materials for producing ammonium bicarbonate are ammonia and carbon dioxide. Fluctuations in the prices of these raw materials directly impact the production cost and, consequently, the price of ammonium bicarbonate, reducing ammonium bicarbonate market opportunities.
  • Energy Costs: The production process is energy-intensive, so changes in energy costs, including electricity and natural gas prices, significantly affect the overall production costs.

Supply and Demand Dynamics:

  • Agricultural Demand: Ammonium bicarbonate is commonly used as a fertilizer in the agricultural sector. Seasonal variations in agricultural activities influence demand, affecting prices.
  • Industrial Demand: It is also used in various industrial applications such as in the food industry as a leavening agent, in pharmaceuticals, and in plastics. Changes in demand from these sectors can lead to price adjustments and affect ammonium bicarbonate market value.
  • Export and Import Levels: The balance between domestic production and international trade (imports and exports) can create supply pressures or relieve them, impacting prices.

Production Capacity and Utilization Rates:

  • Capacity Utilization: The efficiency and utilization rates of production facilities affect the cost of production. High utilization rates typically lower the per-unit cost, which can influence market prices.
  • Plant Maintenance and Downtime: Scheduled and unscheduled maintenance of production plants can affect supply, causing price fluctuations and hindering demand of ammonium bicarbonate market.

Technological Advancements:

  • Production Technology: Advances in production technology can reduce manufacturing costs and increase efficiency, potentially lowering prices.
  • Alternative Processes: Development of alternative production processes that are more cost-effective can influence market prices.

Logistics and Transportation Costs:

  • Freight Costs: Transportation costs for delivering raw materials to production sites and finished products to markets affect the overall price structure and ammonium bicarbonate market revenue.
  • Supply Chain Disruptions: Events such as strikes, natural disasters, or geopolitical tensions that disrupt supply chains can lead to price volatility.

Competitive Landscape

The report gives a detailed analysis of the following key players in the global ammonium bicarbonate market, covering their competitive landscape, capacity, and latest developments like mergers, acquisitions, and investments, expansions of capacity, and plant turnarounds:

  • BASF SE 
  • Sumitomo Chemical Co., Ltd.
  • Nissan Chemical Corporation
  • Mangalore Chemicals & Fertilizers Limited
  • Others

The comprehensive EMR report provides an in-depth assessment of the market based on the Porter's five forces model along with giving a SWOT analysis.

Global Ammonium Bicarbonate Market by Region

Read more about this report - REQUEST FREE SAMPLE COPY IN PDF

Ammonium Bicarbonate Market Regional Analysis

Region-wise, the Asia Pacific region is a significant market for the product, as it holds a major share in the market. The market is driven by the rising food demand, along with the growing population in the region. As per the ammonium bicarbonate market dynamics and trends, expansion of the aforementioned factors is expected to contribute towards the market growth over the forecast period.

Ammonium Bicarbonate Market Report Snapshots

Ammonium Bicarbonate Market Size

Ammonium Bicarbonate Market Growth

Ammonium Bicarbonate Market Trends

Ammonium Bicarbonate Companies

Ammonium Bicarbonate Market Regional Analysis

*While we strive to always give you current and accurate information, the numbers depicted on the website are indicative and may differ from the actual numbers in the main report. At Expert Market Research, we aim to bring you the latest insights and trends in the market. Using our analyses and forecasts, stakeholders can understand the market dynamics, navigate challenges, and capitalize on opportunities to make data-driven strategic decisions.*

Looking for specific insights?

Get in touch with us for a customized solution tailored to your unique requirements and save upto 35%!

Key Questions Answered in the Report

The market is assessed to grow at a CAGR of 4.30% between 2025 and 2034.

The major drivers of the industry, such as rising disposable incomes, increasing population, rising demand form the food industry, growing consumption of packaged food, and the rising demand from the rubber and leather industries, are expected to aid the market growth.

The key trend guiding the growth of the market includes the sustainable growth of the end use industries of the product.

The major regions in the industry are North America, Latin America, the Middle East and Africa, Europe, and the Asia Pacific.

The leading grades of ammonium bicarbonate in the market are food grade, technical grade, and agriculture grade.

The significant end-use sectors in the industry are agricultural, ceramic, food and beverage, pharmaceutical, rubber and leather, and textile, among others.

The major players in the industry are BASF SE, Sumitomo Chemical Co., Ltd., Nissan Chemical Corporation, and Mangalore Chemicals & Fertilizers Limited, among others.

Report Summary

Explore our key highlights of the report and gain a concise overview of key findings, trends, and actionable insights that will empower your strategic decisions.

Key Highlights of the Report

Please note that the figures mentioned in the description serve as estimates and may vary from the actual figures presented in the final report.

REPORT FEATURES DETAILS
Base Year 2024
Historical Period 2018-2024
Forecast Period 2025-2034
Scope of the Report

Historical and Forecast Trends, Industry Drivers and Constraints, Historical and Forecast Market Analysis by Segment:

  • Grade
  • End Use
  • Region
Breakup by Grade
  • Food Grade
  • Technical Grade
  • Agriculture Grade
Breakup by End Use
  • Agricultural
  • Ceramic
  • Food and Beverage
  • Pharmaceutical
  • Rubber and Leather
  • Textile
  • Others
Breakup by Region
  • North America
    • United States of America 
    • Canada
  • Europe
    • United Kingdom
    • Germany
    • France
    • Italy
    • Others
  • Asia Pacific
    • China
    • Japan
    • India
    • ASEAN
    • Australia
    • Others
  • Latin America
    • Brazil
    • Argentina
    • Mexico
    • Others
  • Middle East and Africa
    • Saudi Arabia
    • United Arab Emirates
    • Nigeria
    • South Africa
    • Others
Market Dynamics
  • SWOT Analysis
  • Porter's Five Forces Analysis
  • Key Indicators for Demand
  • Key Indicators for Price
Competitive Landscape
  • Market Structure
  • Company Profiles
    • Company Overview
    • Product Portfolio
    • Demographic Reach and Achievements
    • Certifications
Companies Covered
  • BASF SE
  • Sumitomo Chemical Co., Ltd.
  • Nissan Chemical Corporation
  • Mangalore Chemicals & Fertilizers Limited
  • Others
Report Price and Purchase Option Explore our purchase options that are best suited to your resources and industry needs.
Delivery Format Delivered as an attached PDF and Excel through email, with an option of receiving an editable PPT, according to the purchase option.

Datasheet

10 % Off

USD

2,499

2,249

Single User License

10 % Off

USD

3,999

3,599

Five User License

15 % Off

USD

4,999

4,249

Corporate License

15 % Off

USD

5,999

5,099

  • Report Delivery
  • Purchase Advantages
  • Access Duration
  • Analyst Support
  • Discount on Future Updates
  • Customisation Options
  • Customisation Requests
  • Excel Data Sheet
  • Online Access
  • PDF Format
  • PPT/Word Format
  • 1 Print Allowed
  • Bulk Purchase Discounts
  • Full Report Access
  • Multi-Device Access
  • Unlimited Access
  • One-Time Purchase
  • 3-Month Trade Data Access
  • Consultation Hours
  • Email Support
  • Phone Support
  • Up to 15 Analyst Hours
  • Up to 30 Analyst Hours
  • 5% Discount
  • 10% Discount
  • 15% Discount
  • 20% Discount
  • Basic (Up to 10%)
  • Advanced (Up to 50%)
  • Dedicated Analyst Access
  • Data Visualization Access
  • Custom Data Queries
  • Custom Report Layouts
  • Tailored Custom Summaries
  • Dashboard
  • Purchase Advantages
  • Report Delivery
  • Access Duration
  • Analyst Support
  • Discount on Future Updates
  • Customisation Options
  • Customisation Requests
  • 1 Print Allowed
  • Full Report Access
  • Bulk Purchase Discounts
  • Multi-Device Access
  • PDF Format
  • Online Access
  • Excel Data Sheet
  • PPT/Word Format
  • Unlimited Access
  • One-Time Purchase
  • 3-Month Trade Data Access
  • Consultation Hours
  • Email Support
  • Phone Support
  • Up to 15 Analyst Hours
  • Up to 30 Analyst Hours
  • 5% Discount
  • 10% Discount
  • 15% Discount
  • 20% Discount
  • Basic (Up to 10%)
  • Advanced (Up to 50%)
  • Dedicated Analyst Access
  • Data Visualization Access
  • Custom Data Queries
  • Custom Report Layouts
  • Tailored Custom Summaries
  • Dashboard
  • Purchase Advantages
  • Analyst Support
  • Report Delivery
  • Access Duration
  • Customisation Options
  • Discount on Future Updates
  • Customisation Requests
  • 5 Prints Allowed
  • Full Report Access
  • Bulk Purchase Discounts
  • Limited Device Access
  • Email Support
  • Phone Support
  • Up to 15 Analyst Hours
  • Up to 30 Analyst Hours
  • PDF Format
  • Online Access
  • Excel Data Sheet
  • PPT/Word Format
  • Unlimited Access
  • One-Time Purchase
  • 3-Month Trade Data Access
  • Consultation Hours
  • Basic (Up to 10%)
  • Advanced (Up to 50%)
  • Dedicated Analyst Access
  • Data Visualization Access
  • 5% Discount
  • 10% Discount
  • 15% Discount
  • 20% Discount
  • Custom Data Queries
  • Custom Report Layouts
  • Tailored Custom Summaries
  • Dashboard
  • Report Delivery
  • Purchase Advantages
  • Customisation Options
  • Customisation Requests
  • Analyst Support
  • Access Duration
  • Discount on Future Updates
  • PDF Format
  • Excel Data Sheet
  • PPT/Word Format
  • Online Access
  • Unlimited Prints Available
  • Full Report Access
  • Bulk Purchase Discounts
  • Multi-Device Access
  • Basic (Up to 10%)
  • Advanced (Up to 50%)
  • Dedicated Analyst Access
  • Data Visualization Access
  • Custom Data Queries
  • Custom Report Layouts
  • Tailored Custom Summaries
  • Dashboard
  • Email Support
  • Phone Support
  • Up to 15 Analyst Hours
  • Up to 30 Analyst Hours
  • Unlimited Access
  • One-Time Purchase
  • 3-Month Trade Data Access
  • Consultation Hours
  • 5% Discount
  • 10% Discount
  • 15% Discount
  • 20% Discount

Datasheet

One User

USD 2,499

USD 2,249

tax inclusive*

  • Selected Segments
  • Printing Restrictions
  • Excel Spreadsheet Delivered via Email
  • Full Report
  • Periodic Updates
  • Post Sales Analysts Support
  • Unlimited Prints

Single User License

One User

USD 3,999

USD 3,599

tax inclusive*

  • All Segments
  • Printing Restrictions
  • PDF Delivered via Email
  • Custom Report Layout
  • Post Sales Analysts Support
  • Periodic Updates
  • Unlimited Prints

Five User License

Five User

USD 4,999

USD 4,249

tax inclusive*

  • All Segments
  • Five Prints Available
  • PDF Delivered via Email
  • Limited Free Customization
  • Post Sales Analyst Support
  • Custom Report Layout
  • Periodic Updates
  • Unlimited Prints

Corporate License

Unlimited Users

USD 5,999

USD 5,099

tax inclusive*

  • All Segments
  • Unlimited Prints Available
  • PDF & Excel Delivery via Email
  • Limited Free Customization
  • Post Sales Analysts Support
  • Discount On Next Update
  • Custom Report Layout

*Please note that the prices mentioned below are starting prices for each bundle type. Kindly contact our team for further details.*

Bundle Type

Flash Bundle

20% OFF Number of Reports: 3

Small Business Bundle

25% OFF Number of Reports: 5

Growth Bundle

30% OFF Number of Reports: 8

Enterprise Bundle

35% OFF Number of Reports: 10
Overview
  • Life Time Access
  • Analyst Support Related to Report
  • PDF Version of the Report
  • Complimentary Excel Data Set
  • Free Analyst Hours
  • Complimentary Free 1 Month Subscription to Trade Data Base
  • Complimentary One Month Subscription to Price Database (Chemicals only)
  • Complementary PPT Version of the Report
  • Complimentary License Upgrade
  • Complimentary Power BI Dashboards
  • Life Time Access
  • Analyst Support Related to Report
  • PDF Version of the Report
  • Complimentary Excel Data Set
  • Free Analyst Hours - 50 Hours
  • Complimentary Free 1 Month Subscription to Trade Data Base
  • Complimentary One Month Subscription to Price Database (Chemicals only)
  • Complementary PPT Version of the Report
  • Complimentary License Upgrade
  • Complimentary Power BI Dashboards
  • Life Time Access
  • Analyst Support Related to Report
  • PDF Version of the Report
  • Complimentary Excel Data Set
  • Free Analyst Hours - 80 Hours
  • Complimentary Free 1 Month Subscription to Trade Data Base
  • Complimentary One Month Subscription to Price Database (Chemicals only)
  • Complementary PPT Version of the Report
  • Complimentary License Upgrade
  • Complimentary Power BI Dashboards
  • Life Time Access
  • Analyst Support Related to Report
  • PDF Version of the Report
  • Complimentary Excel Data Set
  • Free Analyst Hours - 100 Hours
  • Complimentary Free 1 Month Subscription to Trade Data Base
  • Complimentary One Month Subscription to Price Database (Chemicals only)
  • Complementary PPT Version of the Report
  • Complimentary License Upgrade
  • Complimentary Power BI Dashboards

*Please note that the prices mentioned below are starting prices for each bundle type. Kindly contact our team for further details.*

Flash Bundle

Number of Reports: 3

20%

tax inclusive*

  • 3 Reports Included
  • Life Time Acess
  • Analyst Support Related to Report
  • PDF Version of the Report
  • Free 1 Month Subscription to Trade Data Base
  • 1 Month Subscription to Price Database (Chemicals only)
  • Complimentary Excel Data Set
  • PPT Version of the Report
  • Power BI Dashboards
  • License Upgrade
  • Free Analyst Hours

Small Business Bundle

Number of Reports: 5

25%

tax inclusive*

  • 5 Reports Included
  • Life Time Acess
  • Analyst Support Related to Report
  • PDF Version of the Report
  • Complimentary Excel Data Set
  • Free Analyst Hours - 50 Hours
  • Free 1 Month Subscription to Trade Data Base
  • 1 Month Subscription to Price Database (Chemicals only)
  • Complimentary Excel Data Set
  • PPT Version of the Report
  • Power BI Dashboards
  • License Upgrade

Growth Bundle

Number of Reports: 8

30%

tax inclusive*

  • 8 Reports Included
  • Life Time Acess
  • Analyst Support Related to Report
  • PDF Version of the Report
  • Complimentary Excel Data Set
  • Free Analyst Hours - 50 Hours
  • Free 1 Month Subscription to Trade Data Base
  • 1 Month Subscription to Price Database (Chemicals only)
  • License Upgrade
  • Free Analyst Hours - 80 Hours
  • Power BI Dashboards

Enterprise Bundle

Number of Reports: 10

35%

tax inclusive*

  • 10 Reports Included
  • Life Time Acess
  • Analyst Support Related to Report
  • PDF Version of the Report
  • Complimentary Excel Data Set
  • Free Analyst Hours - 50 Hours
  • Free 1 Month Subscription to Trade Data Base
  • 1 Month Subscription to Price Database (Chemicals only)
  • License Upgrade
  • Power BI Dashboards
  • Free Analyst Hours - 100 Hours

How To Order

Our step-by-step guide will help you select, purchase, and access your reports swiftly, ensuring you get the information that drives your decisions, right when you need it.

Select License Type

Choose the right license for your needs and access rights.

Click on ‘Buy Now’

Add the report to your cart with one click and proceed to register.

Select Mode of Payment

Choose a payment option for a secure checkout. You will be redirected accordingly.

Strategic Solutions for Informed Decision-Making

Connect For More Information

Our expert team of analysts will offer full support and resolve any queries regarding the report, before and after the purchase.

Our expert team of analysts will offer full support and resolve any queries regarding the report, before and after the purchase.

We employ meticulous research methods, blending advanced analytics and expert insights to deliver accurate, actionable industry intelligence, staying ahead of competitors.

Our skilled analysts offer unparalleled competitive advantage with detailed insights on current and emerging markets, ensuring your strategic edge.

We offer an in-depth yet simplified presentation of industry insights and analysis to meet your specific requirements effectively.

We’re here to help answer any questions about our products and services.

Contact us

Our Offices


Australia

63 Fiona Drive, Tamworth, NSW

+61-448-061-727

India

C130 Sector 2 Noida, Uttar Pradesh 201301

+91-858-608-1494

Philippines

40th Floor, PBCom Tower, 6795 Ayala Avenue Cor V.A Rufino St. Makati City,1226.

+63-287-899-028, +63-967-048-3306

United Kingdom

6 Gardner Place, Becketts Close, Feltham TW14 0BX, Greater London

+44-753-713-2163

United States

30 North Gould Street, Sheridan, WY 82801

+1-415-325-5166

Vietnam

193/26/4 St.no.6, Ward Binh Hung Hoa, Binh Tan District, Ho Chi Minh City

+84-865-399-124

30 North Gould Street, Sheridan, WY 82801

+1-415-325-5166

63 Fiona Drive, Tamworth, NSW

+61-448-061-727

C130 Sector 2 Noida, Uttar Pradesh 201301

+91-858-608-1494

40th Floor, PBCom Tower, 6795 Ayala Avenue Cor V.A Rufino St. Makati City, 1226.

+63-287-899-028, +63-967-048-3306

6 Gardner Place, Becketts Close, Feltham TW14 0BX, Greater London

+44-753-713-2163

193/26/4 St.no.6, Ward Binh Hung Hoa, Binh Tan District, Ho Chi Minh City

+84-865-399-124