

Consumer Insights
Uncover trends and behaviors shaping consumer choices today
Procurement Insights
Optimize your sourcing strategy with key market data
Industry Stats
Stay ahead with the latest trends and market analysis.

The global aluminium cans market reached a value of nearly USD 52.93 Billion in 2025. The market is assessed to grow at a CAGR of 3.20% during the forecast period of 2026-2035 to attain a value of around USD 72.53 Billion by 2035. The market is being aided by the growing emphasis on sustainability, the robust growth of the food and beverage sector, innovations in can design, and the development of IoT-enabled aluminium cans.
Base Year
Historical Period
Forecast Period
Aluminium cans have been witnessing a steady surge in demand, attributed to the robustly growing food and beverage sector and their widespread adoption as the preferred food and beverage packaging material. About 180 billion aluminium cans are used per year, and aluminium cans contain 73% recycled content. The high recyclability of aluminium cans positions them as a sustainable packaging material, aligning with the growing effects of conserving resources and lowering waste.
Countries globally are widely investing in recycling infrastructure for collecting, processing, and reusing aluminium amid the growing commitment to sustainability. With expanding recycling infrastructure, the availability of recycled aluminium is improving, hence making it easier for manufacturers to produce cans with a higher percentage of recycled content.
Key aluminium cans market players are introducing aluminium cans with innovative designs to enhance brand recognition and encourage consumer engagement. For instance, Coca-Cola is renowned for its limited-edition cans featuring unique and seasonal designs. In April 2024, the brand partnered with Marvel to launch limited-edition cans with immersive storytelling.
Compound Annual Growth Rate
3.2%
Value in USD Billion
2026-2035
*this image is indicative*
Aluminium cans are one of the only infinitely recyclable packaging materials available that offer numerous benefits, including long shelf life, lightweight, convenience of usage, improved durability, and corrosion resistance, among others. They also offer improved protection against oxygen, light, and moisture, among others. As a result, the use of aluminium based packaging materials for canned products is gaining traction.
Read more about this report - REQUEST FREE SAMPLE COPY IN PDF
The increasing consumer preference for packaged and processed food products, especially among the working population, is also driving the aluminium cans market growth. Canned products like canned vegetables retain the freshness and nutrients of the product for an extended duration, which allows for the year-round availability of seasonal goods.
The growing investments by the leading market players to expand their production capacity are further driving the aluminium cans demand growth. For instance, in July 2022, CANPACK S.A. announced an increase in its manufacturing capacity of aluminium beverage cans by establishing a new production facility in Poços de Caldas, Brazil.


Robust growth of the beverage sector; ban on single-use plastics; innovations in can design; and the development of smart aluminium cans are favouring the aluminium cans market expansion.
The robust growth of the beverage sector amid the rising demand for energy drinks, carbonated beverages, and alcoholic drinks is surging the demand for aluminium cans due to their portability, convenience, and enhanced shelf stability.
The introduction of stringent government initiatives aimed at reducing the usage of single-use plastics, especially in food and beverage applications, is surging the demand for aluminium cans. Aluminium, being highly recyclable, contributes to a more circular economy and reduces the carbon footprint of the food and beverage sector.
Manufacturers are developing aluminium cans with innovative designs to improve their aesthetics and functionalities and gain a competitive advantage. They are also introducing innovations such as easy-open tabs and pull-rings, finger grips, and handle designs to improve the ergonomics and convenience of aluminium cans.
Smart aluminium cans integrated with QR codes and augmented reality (AR) technology are being developed to create a more immersive connection between the product and customers. Moreover, the development of thermochromic inks that can change colour to indicate the ideal drinking temperature is expected to revolutionise the aluminium cans market landscape in the coming years.
As aluminium serves as an excellent medium for striking and colourful artwork, food and beverage companies are leveraging aluminium cans for direct printing, embossing, and premium labelling as well as crafting distinctive and captivating designs that strengthen their brand image.
Due to their lightweight nature, aluminium cans provide space-efficient packaging options, hence reducing transportation expenses while minimising greenhouse gas emissions associated with logistics. With e-commerce businesses seeking to reduce shipping costs by decreasing the total weight of parcels, the demand for aluminium cans is expected to rise in the coming years.
Read more about this report - REQUEST FREE SAMPLE COPY IN PDF
The EMR’s report titled “Global Aluminium Cans Market Report and Forecast 2026-2035” offers a detailed analysis of the market based on the following segments:
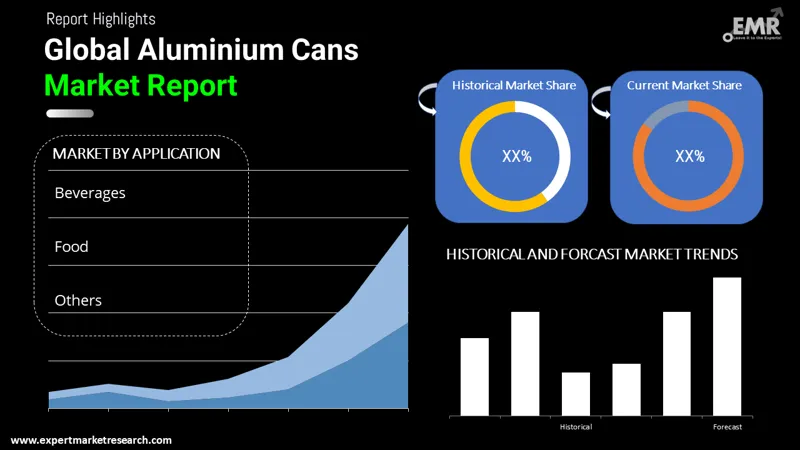
Market Breakup by Application
Market Breakup by Region
As per the aluminium cans market analysis, beverages account for a substantial share of the market. Aluminium cans are widely used to package beverages such as carbonated drinks and beer, among others, due to their durability, high strength, and cost-effectiveness. Benefits such as lightweight properties, infinite recyclability, resistance to oxygen and light, and ease of stackability also make aluminium cans ideal for packaging beverages.
Meanwhile, aluminium cans offer convenience and extended shelf life in food packaging, making them ideal for use in canned and ready-to-eat foods. Innovations in aluminium cans, such as attractive designs, portion control sizes, and easy-open lids, are further driving the segment’s growth.
Key aluminium cans market players are investing in energy-efficient production processes, focusing on lightweight designs, and attempting to reduce overall waste to improve the sustainability of their products. They are also leveraging advanced technologies to create functional and visually distinctive can designs with features like temperature-sensitive inks.
Ball Corp., headquartered in Colorado, United States, and founded in 1880, is a prominent aluminium packaging company. It also provides sustainable packaging solutions for the personal care, beverages, and household products segments. In 2023, the company achieved net sales of USD 14.03 billion.
Crown Holding, Inc., founded in 1892 and headquartered in Florida, United States, has established its position as a prominent supplier of rigid packaging products and protective packaging products, services, and equipment to various end-use sectors. With 195 manufacturing plants and sales and service facilities in 39 countries, the company generated net sales of USD 12 billion in 2023.
Norsk Hydro ASA, established in 1905, is a prominent aluminium and renewable energy company, headquartered in Oslo, Norway. With 31,000 employees in more than 140 locations and 40 countries, the company aims to develop natural resources into products and solutions in innovative and efficient ways.
*Please note that this is only a partial list; the complete list of key players is available in the full report. Additionally, the list of key players can be customized to better suit your needs.*
Latin America Aluminium Cans Market
North America Aluminium Cans Market


Upto 15% Off
USD
$2499 $2249
$3999 $3599
$4999 $4249
$5999 $5099


*While we strive to always give you current and accurate information, the numbers depicted on the website are indicative and may differ from the actual numbers in the main report. At Expert Market Research, we aim to bring you the latest insights and trends in the market. Using our analyses and forecasts, stakeholders can understand the market dynamics, navigate challenges, and capitalize on opportunities to make data-driven strategic decisions.*
Get in touch with us for a customized solution tailored to your unique requirements and save upto 35%!
In 2025, the market reached an approximate value of USD 52.93 Billion.
The market is assessed to grow at a CAGR of 3.20% between 2026 and 2035.
The market is estimated to witness healthy growth in the forecast period of 2026-2035 to reach a value of around USD 72.53 Billion by 2035.
Factors such as rising disposable incomes, increasing population, and increasing demand for aluminium cans from food, pharmaceuticals, oil, chemicals, and other industries, are driving the growth of the market.
The rising eco-consciousness and recycling of the aluminium cans are among the key trends aiding the industry growth.
The major regions in the market are North America, Europe, the Asia Pacific, Latin America, and the Middle East and Africa, with North America accounting for the largest market share.
Based on application, the beverage segment accounts for the largest market share.
The major players in the market include Ball Corp., Crown Holding, Inc., and Norsk Hydro ASA, among others.
Explore our key highlights of the report and gain a concise overview of key findings, trends, and actionable insights that will empower your strategic decisions.
| REPORT FEATURES | DETAILS |
| Base Year | 2025 |
| Historical Period | 2019-2025 |
| Forecast Period | 2026-2035 |
| Scope of the Report |
Historical and Forecast Trends, Industry Drivers and Constraints, Historical and Forecast Market Analysis by Segment:
|
| Breakup by Application |
|
| Breakup by Region |
|
| Market Dynamics |
|
| Competitive Landscape |
|
| Companies Covered |
|
| Report Price and Purchase Option | Explore our purchase options that are best suited to your resources and industry needs. |
| Delivery Format | Delivered as an attached PDF and Excel through email, with an option of receiving an editable PPT, according to the purchase option. |
Datasheet
One User
USD 2,499
USD 2,249
tax inclusive*
Single User License
One User
USD 3,999
USD 3,599
tax inclusive*
Five User License
Five User
USD 4,999
USD 4,249
tax inclusive*
Corporate License
Unlimited Users
USD 5,999
USD 5,099
tax inclusive*
*Please note that the prices mentioned below are starting prices for each bundle type. Kindly contact our team for further details.*
Flash Bundle
Small Business Bundle
Growth Bundle
Enterprise Bundle
*Please note that the prices mentioned below are starting prices for each bundle type. Kindly contact our team for further details.*
Flash Bundle
Number of Reports: 3
20%
tax inclusive*
Small Business Bundle
Number of Reports: 5
25%
tax inclusive*
Growth Bundle
Number of Reports: 8
30%
tax inclusive*
Enterprise Bundle
Number of Reports: 10
35%
tax inclusive*
How To Order

Select License Type
Choose the right license for your needs and access rights.

Click on ‘Buy Now’
Add the report to your cart with one click and proceed to register.

Select Mode of Payment
Choose a payment option for a secure checkout. You will be redirected accordingly.
Gain insights to stay ahead and seize opportunities.

Get insights & trends for a competitive edge.

Track prices with detailed trend reports.

Analyse trade data for supply chain insights.

Leverage cost reports for smart savings

Enhance supply chain with partnerships.

Connect For More Information
Our expert team of analysts will offer full support and resolve any queries regarding the report, before and after the purchase.
Our expert team of analysts will offer full support and resolve any queries regarding the report, before and after the purchase.
We employ meticulous research methods, blending advanced analytics and expert insights to deliver accurate, actionable industry intelligence, staying ahead of competitors.
Our skilled analysts offer unparalleled competitive advantage with detailed insights on current and emerging markets, ensuring your strategic edge.
We offer an in-depth yet simplified presentation of industry insights and analysis to meet your specific requirements effectively.


Share