

Consumer Insights
Uncover trends and behaviors shaping consumer choices today
Procurement Insights
Optimize your sourcing strategy with key market data
Industry Stats
Stay ahead with the latest trends and market analysis.
Trending Now


The global market size for alternative proteins reached a value of more than 19.06 MMT in 2024. The global alternative proteins market is expected to grow at a CAGR of 13.40% in the forecast period of 2025-2034, reaching a projected value of 67.03 MMT by 2034.
Base Year
Historical Period
Forecast Period


Value in MMT
2025-2034
Alternative Proteins Market Outlook
*this image is indicative*
| Global Alternative Proteins Market Report Summary | Description | Value |
| Base Year | MMT | 2024 |
| Historical Period | MMT | 2018-2024 |
| Forecast Period | MMT | 2025-2034 |
| Market Size 2024 | MMT | 19.06 |
| Market Size 2034 | MMT | 67.03 |
| CAGR 2018-2024 | Percentage | XX% |
| CAGR 2025-2034 | Percentage | 13.40% |
| CAGR 2025-2034 - Market by Region | Asia Pacific | 14.3% |
| CAGR 2025-2034 - Market by Country | India | 14.6% |
| CAGR 2025-2034 - Market by Country | China | 14.2% |
| CAGR 2025-2034 - Market by Source | Cellular Agriculture | 14.8% |
| CAGR 2025-2034 - Market by Ingredient | Specialty Ingredients | 14.7% |
| Market Share by Country 2024 | Australia | 2.2% |
Read more about this report - REQUEST FREE SAMPLE COPY IN PDF
Alternative protein sources include everything from algae to re-engineered plant-based legumes as well as a variety of substitutes for meat. It comprises food products made from fungi (mushrooms), plants (for instance, legumes, nuts, and grains), algae, cultured (lab-grown) meat, and insects.
The EMR’s report titled “Alternative Proteins Market Report and Forecast 2025-2034” offers a detailed analysis of the market based on the following segments:
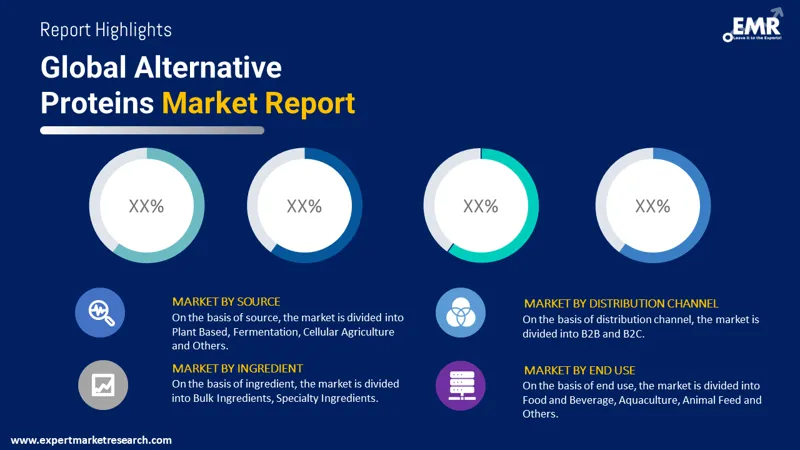
Market Breakup by Source
Market Breakup by Ingredient
Market Breakup by End Use
Market Breakup by Distribution Channel
Market Breakup by Region
Read more about this report - REQUEST FREE SAMPLE COPY IN PDF
The plant based segment is expected to witness substantial growth in the alternative proteins market share on account of the increasing demand from food and beverage producers and the rise in the vegan population.
The growing number of plant-based product launches coupled with the large presence of plant protein producers are expected to boost the market growth of alternative protein over the coming years. The increase in veganism in various regions coupled with surging awareness among customers about the harmful health effects of meat and meat products is further expected to influence the market growth of alternative protein.


Geographically, the North America region is augmenting the alternative proteins market as consumers are concerned regarding the ingredients used in food products in the region. The health impacts and sustainability are playing a significant role when choosing alternative proteins, and influencing the market demand across the region. The rising demand for nutritious ingredients coupled with growing customer attention toward preventive healthcare is driving the sales of alternative proteins, especially in Canada and the United States.
| CAGR 2025-2034 - Market by | Country |
| India | 14.6% |
| China | 14.2% |
| Brazil | 14.2% |
| Canada | 14.1% |
| Saudi Arabia | 14.1% |
| USA | XX% |
| UK | 13.7% |
| France | XX% |
| Italy | XX% |
| Japan | XX% |
| Australia | XX% |
| Mexico | 13.7% |
| Germany | 13.0% |
Meanwhile, the Asia Pacific region is expected to fuel the market growth of alternative proteins on account of the vast agriculture sector. Additionally, sourcing proteins from organic food components is easier in the region. With the rise in the lactose intolerant population in the region, the alternative proteins market is likely to grow during the forecast period, especially in countries like India and China. The growing research and development activities and the rise in start-ups innovating various types of alternative proteins are expected to boost the regional market growth.
The comprehensive EMR report provides an in-depth assessment of the market based on the Porter's five forces model along with giving a SWOT analysis. The report gives a detailed analysis of the following key players in the global alternative proteins market, covering their competitive landscape and latest developments like mergers, acquisitions, investments and expansion plans.
E.I. Dupont De Nemours and Company is a leading multi-industry specialty company with a vast global businesses associated with developing agricultural products, technologies, and speciality products.
Greenleaf Foods SPC is dedicated to forming the future of plant-based foods. The leading plant-based protein brand incorporates light life foods and field roast. The company is changing plant-based protein with a huge range of delightful as well as advanced products that cater to customers interested in adding protein to their diets.
Glanbia Plc is a global leader in performance along with lifestyle nutrition, with a family of nine brands. The company aims to encourage people all around the globe to attain their performance as well as healthy lifestyle goals.
Archer Daniels Midland Company is the world’s largest nutrition company. The company is leading both human and animal nutrition. It transforms crops into ingredients as well as solutions for foods, beverages, and supplements for people worldwide with a portfolio of solutions and services for livestock, pets, and aquaculture.
*Please note that this is only a partial list; the complete list of key players is available in the full report. Additionally, the list of key players can be customized to better suit your needs.*
Other market players include Darling Ingredients, Cargill Incorporated, Kerry Group, and Calysta, among others.
*While we strive to always give you current and accurate information, the numbers depicted on the website are indicative and may differ from the actual numbers in the main report. At Expert Market Research, we aim to bring you the latest insights and trends in the market. Using our analyses and forecasts, stakeholders can understand the market dynamics, navigate challenges, and capitalize on opportunities to make data-driven strategic decisions.*
Get in touch with us for a customized solution tailored to your unique requirements and save upto 35%!
In 2024, the global market size for alternative proteins attained a value of nearly 19.06 MMT.
The market is assessed to grow at a CAGR of 13.40% between 2025 and 2034.
The market is estimated to witness healthy growth in the forecast period of 2025-2034 to reach almost 67.03 MMT by 2034.
The major drivers are growing urbanisation along with the rise in demand for natural and healthy products and health awareness.
The key market trends include the increasing disposable income among people and growing trend of veganism.
The major regions in the global alternative proteins market are North America, Europe, the Asia Pacific, Latin America, and the Middle East and Africa.
The various sources include plant based, fermentation, and cellular agriculture, among others.
The different ingredients include bulk ingredients and specialty ingredients.
The various end-uses of the alternative proteins market include food and beverage, aquaculture, and animal feed, among others.
The various distribution channels of alternative proteins include B2B and B2C.
The major players in the market are E.I. Dupont De Nemours and Company, Greenleaf Foods SPC, Glanbia Plc, Archer Daniels Midland Company, Darling Ingredients, Cargill Incorporated, Kerry Group, and Calysta, among others.
Explore our key highlights of the report and gain a concise overview of key findings, trends, and actionable insights that will empower your strategic decisions.
| REPORT FEATURES | DETAILS |
| Base Year | 2024 |
| Historical Period | 2018-2024 |
| Forecast Period | 2025-2034 |
| Scope of the Report |
Historical and Forecast Trends, Industry Drivers and Constraints, Historical and Forecast Market Analysis by Segment:
|
| Breakup by Source |
|
| Breakup by Ingredient |
|
| Breakup by End Use |
|
| Breakup by Distribution Channel |
|
| Breakup by Region |
|
| Market Dynamics |
|
| Competitive Landscape |
|
| Companies Covered |
|
Datasheet
One User
USD 2,499
USD 2,249
tax inclusive*
Single User License
One User
USD 3,999
USD 3,599
tax inclusive*
Five User License
Five User
USD 4,999
USD 4,249
tax inclusive*
Corporate License
Unlimited Users
USD 5,999
USD 5,099
tax inclusive*
*Please note that the prices mentioned below are starting prices for each bundle type. Kindly contact our team for further details.*
Flash Bundle
Small Business Bundle
Growth Bundle
Enterprise Bundle
*Please note that the prices mentioned below are starting prices for each bundle type. Kindly contact our team for further details.*
Flash Bundle
Number of Reports: 3
20%
tax inclusive*
Small Business Bundle
Number of Reports: 5
25%
tax inclusive*
Growth Bundle
Number of Reports: 8
30%
tax inclusive*
Enterprise Bundle
Number of Reports: 10
35%
tax inclusive*
How To Order
Our step-by-step guide will help you select, purchase, and access your reports swiftly, ensuring you get the information that drives your decisions, right when you need it.

Select License Type
Choose the right license for your needs and access rights.

Click on ‘Buy Now’
Add the report to your cart with one click and proceed to register.

Select Mode of Payment
Choose a payment option for a secure checkout. You will be redirected accordingly.
Track prices with detailed trend reports.

Analyse trade data for supply chain insights.

Leverage cost reports for smart savings

Enhance supply chain with partnerships.

Gain insights to stay ahead and seize opportunities.

Get insights & trends for a competitive edge.

Track prices with detailed trend reports.
Analyse trade data for supply chain insights.
Leverage cost reports for smart savings
Enhance supply chain with partnerships.
Gain insights to stay ahead and seize opportunities.
Get insights & trends for a competitive edge.
Track prices with detailed trend reports.
Analyse trade data for supply chain insights.
Connect For More Information
Our expert team of analysts will offer full support and resolve any queries regarding the report, before and after the purchase.
Our expert team of analysts will offer full support and resolve any queries regarding the report, before and after the purchase.
We employ meticulous research methods, blending advanced analytics and expert insights to deliver accurate, actionable industry intelligence, staying ahead of competitors.
Our skilled analysts offer unparalleled competitive advantage with detailed insights on current and emerging markets, ensuring your strategic edge.
We offer an in-depth yet simplified presentation of industry insights and analysis to meet your specific requirements effectively.
Australia
63 Fiona Drive, Tamworth, NSW
+61-448-061-727
India
C130 Sector 2 Noida, Uttar Pradesh 201301
+91-723-689-1189
Philippines
40th Floor, PBCom Tower, 6795 Ayala Avenue Cor V.A Rufino St. Makati City,1226.
+63-287-899-028, +63-967-048-3306
United Kingdom
6 Gardner Place, Becketts Close, Feltham TW14 0BX, Greater London
+44-753-713-2163
United States
30 North Gould Street, Sheridan, WY 82801
+1-415-325-5166
Vietnam
193/26/4 St.no.6, Ward Binh Hung Hoa, Binh Tan District, Ho Chi Minh City
+84-865-399-124
United States (Head Office)
30 North Gould Street, Sheridan, WY 82801
+1-415-325-5166
Australia
63 Fiona Drive, Tamworth, NSW
+61-448-061-727
India
C130 Sector 2 Noida, Uttar Pradesh 201301
+91-723-689-1189
Philippines
40th Floor, PBCom Tower, 6795 Ayala Avenue Cor V.A Rufino St. Makati City, 1226.
+63-287-899-028, +63-967-048-3306
United Kingdom
6 Gardner Place, Becketts Close, Feltham TW14 0BX, Greater London
+44-753-713-2163
Vietnam
193/26/4 St.no.6, Ward Binh Hung Hoa, Binh Tan District, Ho Chi Minh City
+84-865-399-124


Share