

Consumer Insights
Uncover trends and behaviors shaping consumer choices today
Procurement Insights
Optimize your sourcing strategy with key market data
Industry Stats
Stay ahead with the latest trends and market analysis.
Trending Now


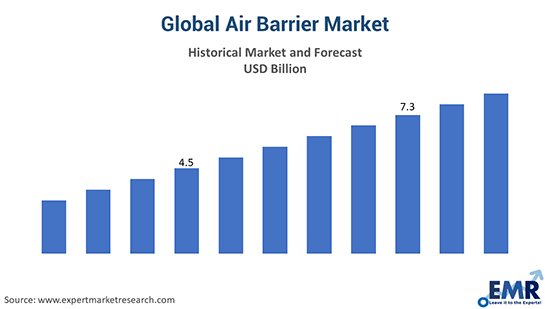
The global air barrier market value reached almost USD 7.59 Billion in 2024. The market is expected to grow at a CAGR of 4.90% between 2025 and 2034 to reach a value of nearly USD 12.25 Billion by 2034.
Base Year
Historical Year
Forecast Year


Value in USD Billion
2025-2034
Air Barrier Market Outlook
*this image is indicative*
| Global Air Barrier Market Report Summary | Description | Value |
| Base Year | USD Billion | 2024 |
| Historical Period | USD Billion | 2018-2024 |
| Forecast Period | USD Billion | 2025-2034 |
| Market Size 2024 | USD Billion | 7.59 |
| Market Size 2034 | USD Billion | 12.25 |
| CAGR 2018-2024 | Percentage | XX% |
| CAGR 2025-2034 | Percentage | 4.90% |
| CAGR 2025-2034 - Market by Region | Asia Pacific | 5.9% |
| CAGR 2025-2034 - Market by Region | Middle East and Africa | 5.0% |
| CAGR 2025-2034 - Market by Membrane Type | Fluid Applied | 5.3% |
| CAGR 2025-2034 - Market by Application | Masonry | 5.1% |
| CAGR 2025-2034 - Market by Country | India | 7.1% |
| 2024 Market Share by Country | USA | 22.1 |
Air barriers are crucial in infrastructure construction, improving energy efficiency by reducing air leakage and protecting buildings from moisture-related damage.
Read more about this report - REQUEST FREE SAMPLE COPY IN PDF
The global air barrier market is driven by the increase in the demand for the product from infrastructure and construction industries.
The rise in demand for energy-efficient and green buildings are supporting the growth of the market. The product contributes towards green certification for buildings by reducing the property owner's heating and cooling costs, while enhancing comfort. According to 2023 data, around 40% of the energy consumption in buildings is attributed to heating, cooling, and lighting.


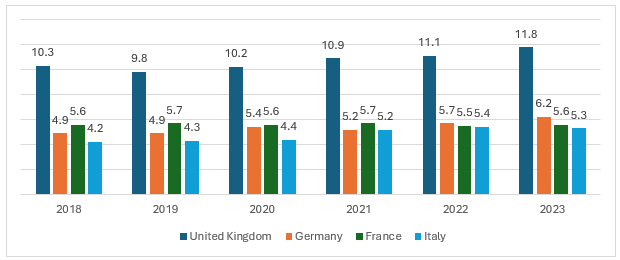
In the United Kingdom, government investment in infrastructure surged by 9.6% in 2022 compared to the previous year. In 2023, new infrastructure projects saw an additional increase of USD 2.89 billion, reflecting robust growth in the sector. FEMA's increased infrastructure spending on rebuilding public utilities and buildings after natural disasters is expected to drive the demand for air barrier systems to enhance energy efficiency, moisture control, and structural integrity in newly constructed or renovated structures. Global construction spending is projected to escalate from USD 13 trillion in 2023 to USD 22 trillion in 2040, growing at a CAGR of 3.2%.
Figure: Share of Construction (%) in GDP in the EU; 2018-2024
Air barrier systems play a crucial role in improving a building’s energy efficiency by reducing air leakage and enhancing thermal performance, which can contribute towards achieving LEED (Leadership in Energy and Environmental Design) certification.
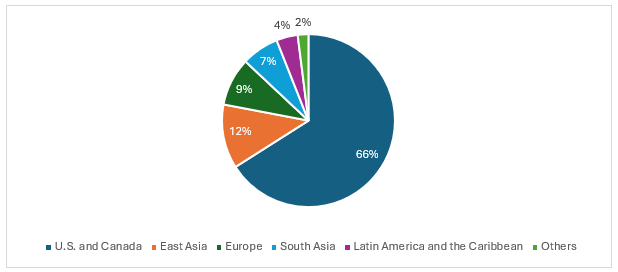
According to 2024 data, the National Institute of Standards and Technology reports that air leakage can be responsible for as much as 40% of heating expenses and 15% of cooling costs in commercial properties. From January 2017 to December 2021, more than 36,835 projects earned LEED certification, spanning 4.63 billion square feet. In the first three quarters of 2022 alone, over 5,000 additional projects were certified, marking a recovery from a dip in certifications in 2019, followed by consistent annual growth.
Figure: Global LEED Project Registrations by Region; (2017-2021)
Rising demand for sustainable construction materials; growing construction sector; rise in number of ageing buildings; and renovation activities are the key trends impacting the global air barrier market expansion
The adoption of efficient building materials and sustainable practices is increasing as the construction industry seeks to align with the International Energy Agency’s Net Zero Emissions by 2050 Scenario. This scenario requires that all new buildings and 20% of existing structures be zero-carbon-ready by 2030, driving demand for solutions like air barriers that enhance energy efficiency.
The construction sector globally is supported by investments in manufacturing, transportation infrastructure, residential projects, and commercial establishments. North America, a significant market for air barriers, is driven by the construction sector in the USA and Canada. According to 2024 data, construction accounts for 4% of GDP in the USA and 7.5% of GDP in Canada.
The age of a building impacts its energy efficiency, as older structures are typically less airtight and more prone to moisture retention, leading to dampness and potential mold growth. Excess moisture significantly affects heat loss and energy efficiency. According to 2020 data, the UK has the oldest housing stock in the world, with over 25% of homes in Wales being 100 years old or more.
Increased focus on upgrading existing buildings to meet energy standards provides an opportunity for air barriers. In the EU, buildings contribute over one-third of energy-related greenhouse gas emissions, according to 2023 data. Improving their energy performance is essential for achieving climate neutrality by mid-century. The EU’s renovation wave aims to double the annual energy renovation rate for residential and non-residential buildings by 2030 and initiate deep renovations that could reduce energy consumption by at least 60%.
Air barriers are crucial for buildings to meet stringent energy codes, as they reduce the workload on heating and cooling systems, thereby lowering energy consumption. Modern standards like ASHRAE 90.1 and the International Energy Conservation Code (IECC) set performance criteria for thermal envelopes, including air barriers. Data from 2024 shows that effective air barrier systems can reduce energy use by 10% to 40%, with even greater savings in regions with extreme weather, where energy demands for climate control are high.

Read more about this report - REQUEST FREE SAMPLE COPY IN PDF
“Global Air Barrier Market Report and Forecast 2024-2032” offers a detailed analysis of the market based on the following segments:
Market Breakup by Membrane Type:
Market Breakup by Application:
Market Breakup by End Use:
Market Breakup by Region:
Based on end use, the residential sector accounts for a significant share of the market
Airtightness has a substantial effect on a building's energy consumption. Typically, buildings equipped with effective air barrier systems can achieve energy savings of 10% to 40%.
According to the International Energy Agency (IEA) estimates for 2023, buildings represent around 30% of global final energy consumption and contribute to 26% of global energy-related emissions.
Meanwhile, in the USA, a key market of air barriers, early adopter design professionals and states like Vermont, Pennsylvania, Connecticut, New York, and Illinois, have rapidly embraced air barriers in commercial construction. This technology is valued for its role in improving building sustainability and efficiency. According to 2022 data, the average rent of office buildings with LEED certification in the USA is 31% higher than that of non-LEED-certified buildings.
Based on membrane type, fluid applied is a major contributor to the global air barrier market revenue
Fluid-applied membranes require fewer applicators, which reduces labor costs. These membranes are easier to install around penetrations, such as electrical conduits or brick ties and uneven substrates. Prominent manufacturers of fluid-applied membranes include W. R. MEADOWS, Carlisle Companies Incorporated, and Prosoco, Inc.
Meanwhile, sheet-applied air barrier systems do not shrink, sag, dry out, crack, or rot, and offer impressive resistance to punctures during installation. This makes them ideal for earthquake zones, shifting soils and areas where high groundwater pressure is common.
Prominent manufacturers of sheet-applied membranes include Henry Company, W. R. MEADOWS, and GCP Applied Technologies.
The market players are focusing on providing products at competitive prices and high quality, with improved customer service, product support, and performance features.
BASF specialises in production and distribution of a range of products, including chemicals, plastics, performance products, crop protection products, and oil and gas, among others. The company, headquartered in Germany comprises of six business segments, which include Chemicals, Materials, Industrial Solutions, Surface Technologies, Nutrition & Care, and Agricultural Solutions.
DuPont is a technology leader, serving the semiconductor, circuit board, display, digital and flexographic printing, healthcare, aerospace, industrial and transportation industries. Founded in 1802, the company is known for its wide array of products including additives and modifiers for polymers, electronic technologies, construction materials, and others.
W.R. Meadows designs, manufactures, and markets high-quality building materials for today’s construction professionals. Based in the USA, W.R. Meadows, Inc. operates across 14 strategically located manufacturing facilities and fully stocked warehouse operations in the United States and Canada and 4 warehouse facilities in Chile, Austria, Germany, Switzerland.
Carlisle Companies is a leading supplier of innovative building envelope products and solutions for more energy-efficient buildings. The company offers building products through its following businesses which include Carlisle Construction Materials (“CCM”) and Carlisle Weatherproofing Technologies (“CWT”).
*Please note that this is only a partial list; the complete list of key players is available in the full report. Additionally, the list of key players can be customized to better suit your needs.*
Other notable players operating in the global air barrier market are Soprema S.A.S, 3M Company, and Sika AG, among others.
In 2023, in Europe, non-residential construction activity accounted for the largest share of 31.8%. Renovation and maintenance followed closely, comprising 30.3% of activities. Housebuilding contributed 19.9%, while civil engineering made up 17.9% of the total construction activities during the year. In Germany, advancing urbanisation is putting pressure on metropolitan regions with around 4.4 million new homes required to be built by 2030 to meet the demand, thus increasing the installation of air barriers.
| CAGR 2025-2034 - Market by | Country |
| India | 7.1% |
| Brazil | 5.4% |
| UK | 5.2% |
| USA | 4.5% |
| France | 4.4% |
| Japan | 4.4% |
| Canada | XX% |
| Germany | XX% |
| Italy | XX% |
| China | XX% |
| Australia | XX% |
| Mexico | XX% |
| Saudi Arabia | 4.3% |
Further, the Asia Pacific air barrier market is set for growth alongside China's construction industry, which saw year-over-year increase of 5.8% in 2023. The market expansion of air barrier systems in the region is driven by the robust construction sector and the focus on energy-efficient building solutions.
*While we strive to always give you current and accurate information, the numbers depicted on the website are indicative and may differ from the actual numbers in the main report. At Expert Market Research, we aim to bring you the latest insights and trends in the market. Using our analyses and forecasts, stakeholders can understand the market dynamics, navigate challenges, and capitalize on opportunities to make data-driven strategic decisions.*
Get in touch with us for a customized solution tailored to your unique requirements and save upto 35%!
The global market for air barriers attained a value of USD 7.59 Billion in 2024.
The market is estimated to grow at a CAGR of 4.90% during 2025-2034.
The market is estimated to witness a healthy growth in the forecast period of 2025-2034 to reach a value of USD 12.25 Billion by 2034.
The factors driving the market growth are increasing inclination towards environment-friendly construction methods and products, rising renovation activities, and expansion of the construction sector.
The increase in demand for energy-efficient and green buildings is expected to be a key trend guiding the growth of the market.
The key regional markets for air barrier are North America, Europe, the Asia Pacific, Latin America, and the Middle East and Africa.
Sheet applied is the dominant membrane type of the product in the market.
The end uses include residential, commercial, and public infrastructure.
The applications include masonry, gypsum board, glass, plywood, and others.
The key players in the market include BASF SE, DuPont de Nemours, Inc., W. R. Meadows, Inc, Carlisle Companies Inc., Soprema S.A.S, 3M Company, and Sika AG, among others.
Explore our key highlights of the report and gain a concise overview of key findings, trends, and actionable insights that will empower your strategic decisions.
| REPORT FEATURES | DETAILS |
| Base Year | 2024 |
| Historical Period | 2018-2024 |
| Forecast Period | 2025-2034 |
| Scope of the Report |
Historical and Forecast Trends, Industry Drivers and Constraints, Historical and Forecast Market Analysis by Segment:
|
| Breakup by Membrane Type |
|
| Breakup by Application |
|
| Breakup by End Use |
|
| Breakup by Region |
|
| Market Dynamics |
|
| Competitive Landscape |
|
| Companies Covered |
|
| Report Price and Purchase Option | Explore our purchase options that are best suited to your resources and industry needs. |
| Delivery Format | Delivered as an attached PDF and Excel through email, with an option of receiving an editable PPT, according to the purchase option. |
Single User License
One User
USD 3,999
USD 3,599
tax inclusive*
Datasheet
One User
USD 2,499
USD 2,249
tax inclusive*
Five User License
Five User
USD 4,999
USD 4,249
tax inclusive*
Corporate License
Unlimited Users
USD 5,999
USD 5,099
tax inclusive*
*Please note that the prices mentioned below are starting prices for each bundle type. Kindly contact our team for further details.*
Flash Bundle
Small Business Bundle
Growth Bundle
Enterprise Bundle
*Please note that the prices mentioned below are starting prices for each bundle type. Kindly contact our team for further details.*
Flash Bundle
Number of Reports: 3
20%
tax inclusive*
Small Business Bundle
Number of Reports: 5
25%
tax inclusive*
Growth Bundle
Number of Reports: 8
30%
tax inclusive*
Enterprise Bundle
Number of Reports: 10
35%
tax inclusive*
How To Order
Our step-by-step guide will help you select, purchase, and access your reports swiftly, ensuring you get the information that drives your decisions, right when you need it.

Select License Type
Choose the right license for your needs and access rights.

Click on ‘Buy Now’
Add the report to your cart with one click and proceed to register.

Select Mode of Payment
Choose a payment option for a secure checkout. You will be redirected accordingly.
Gain insights to stay ahead and seize opportunities.

Get insights & trends for a competitive edge.

Track prices with detailed trend reports.

Analyse trade data for supply chain insights.

Leverage cost reports for smart savings

Enhance supply chain with partnerships.

Connect For More Information
Our expert team of analysts will offer full support and resolve any queries regarding the report, before and after the purchase.
Our expert team of analysts will offer full support and resolve any queries regarding the report, before and after the purchase.
We employ meticulous research methods, blending advanced analytics and expert insights to deliver accurate, actionable industry intelligence, staying ahead of competitors.
Our skilled analysts offer unparalleled competitive advantage with detailed insights on current and emerging markets, ensuring your strategic edge.
We offer an in-depth yet simplified presentation of industry insights and analysis to meet your specific requirements effectively.
Australia
63 Fiona Drive, Tamworth, NSW
+61-448-061-727
India
C130 Sector 2 Noida, Uttar Pradesh 201301
+91-723-689-1189
Philippines
40th Floor, PBCom Tower, 6795 Ayala Avenue Cor V.A Rufino St. Makati City,1226.
+63-287-899-028, +63-967-048-3306
United Kingdom
6 Gardner Place, Becketts Close, Feltham TW14 0BX, Greater London
+44-753-713-2163
United States
30 North Gould Street, Sheridan, WY 82801
+1-415-325-5166
Vietnam
193/26/4 St.no.6, Ward Binh Hung Hoa, Binh Tan District, Ho Chi Minh City
+84-865-399-124
United States (Head Office)
30 North Gould Street, Sheridan, WY 82801
+1-415-325-5166
Australia
63 Fiona Drive, Tamworth, NSW
+61-448-061-727
India
C130 Sector 2 Noida, Uttar Pradesh 201301
+91-723-689-1189
Philippines
40th Floor, PBCom Tower, 6795 Ayala Avenue Cor V.A Rufino St. Makati City, 1226.
+63-287-899-028, +63-967-048-3306
United Kingdom
6 Gardner Place, Becketts Close, Feltham TW14 0BX, Greater London
+44-753-713-2163
Vietnam
193/26/4 St.no.6, Ward Binh Hung Hoa, Binh Tan District, Ho Chi Minh City
+84-865-399-124


Share