

Consumer Insights
Uncover trends and behaviors shaping consumer choices today
Procurement Insights
Optimize your sourcing strategy with key market data
Industry Stats
Stay ahead with the latest trends and market analysis.

The Africa renewable energy market reached an installation capacity of nearly 3099.38 Gigawatt in 2025. Expansion of carbon credit-backed solar projects in East Africa is fuelling new financing models, enabling faster deployment of microgeneration assets while improving returns for clean energy developers and financiers. As a result, the market is expected to grow at a CAGR of 6.00% during the forecast period of 2026-2035 to reach nearly 5550.52 Gigawatt by 2035.
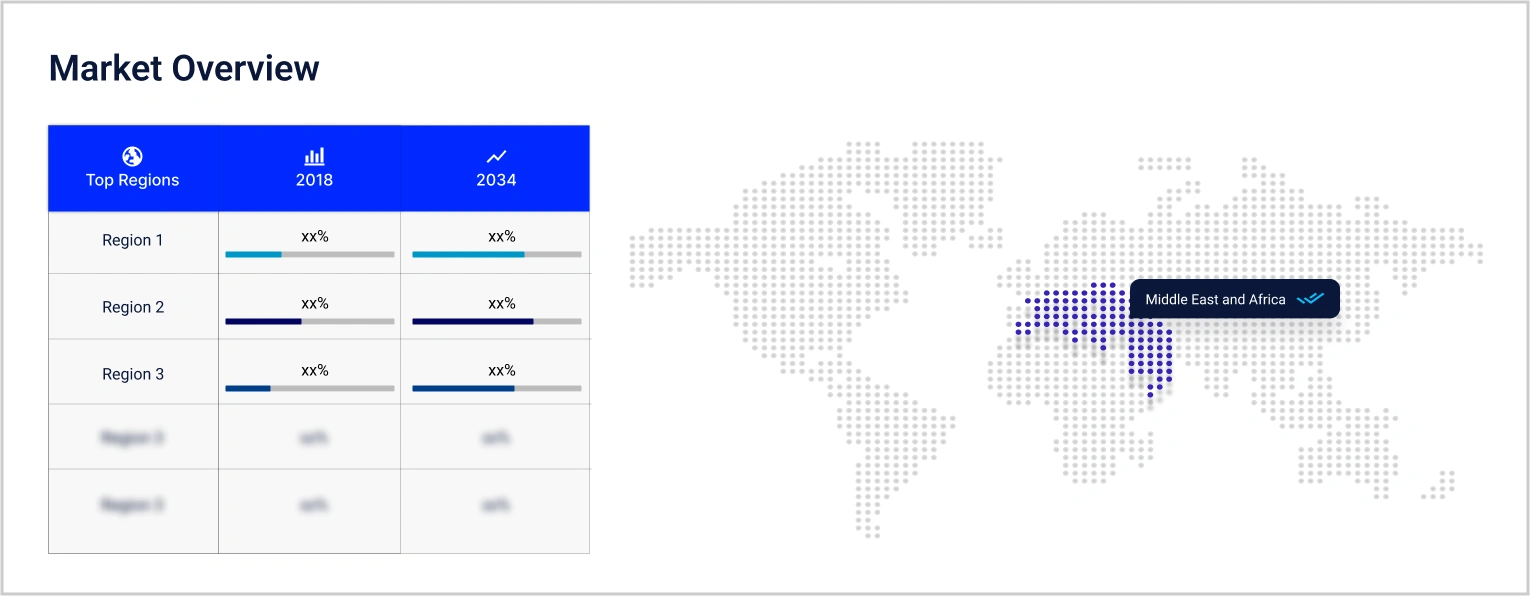
The market is expected to be boosted by a robust expansion of photovoltaic capacity in the coming years. The leading countries in terms of the largest installed capacity are South Africa, Ethiopia, Morocco, and Egypt. By 2030, the International Renewable Energy Agency (IRENA) forecasts that Africa could meet nearly 22% of its electricity demand through renewable energy. Moreover, the Africa Renewable Energy Initiative (AREI), supported by the African Union, targets an additional 300 GW of renewable capacity by 2030. One key effort boosting the market development is the Desert to Power initiative led by the African Development Bank, aims to provide solar electricity to 250 million people across 11 Sahel regions.
South Africa has emerged as a regional leader boosting the overall Africa renewable energy market development, owing to its Renewable Energy Independent Power Producer Procurement Program (REIPPPP), which has unlocked USD 16 billion in investments and led to the deployment of 6.2 GW of capacity since 2011. Similarly, Kenya is tapping into geothermal potential, now accounting for more than 47% of its electricity generation.
Africa is witnessing growth not only in terms of vast renewable potential, but also due to the deployment of innovative, scalable models. Coupled with improving regulatory frameworks and growing public-private partnerships, these developments signal a promising Africa renewable energy market outlook. However, ensuring grid stability, financing consistency, and addressing regional disparities remain pressing concerns for stakeholders pushing this energy transformation forward.
Base Year
Historical Period
Forecast Period
Compound Annual Growth Rate
6%
Value in Gigawatt
2026-2035
*this image is indicative*
Read more about this report - REQUEST FREE SAMPLE COPY IN PDF
The region is witnessing a growing number of joint ventures between governments and global investors. For instance, in March 2025, IFC partnered with local developers in Côte d’Ivoire to support housing development projects, indirectly boosting the renewable energy demand in Africa. These collaborations fast-track project execution and ensure technical support and financial viability. Governments are now offering risk guarantees and incentives for foreign firms, promoting scalability. This trend strengthens investor confidence while localising renewable energy solutions, encouraging community ownership. Such synergies are essential in addressing Africa’s 600 million energy-deficit population with clean, affordable sources.
West Africa is becoming a significant hub for off-grid solar projects tailored to low-income, rural populations, thereby boosting the Africa renewable energy market value. For example, Nigeria’s 5Million Solar Power Naija programme aims to electrify 5 million households with decentralised solar solutions by 2030. This is fostering a surge in modular solar technology adoption, such as Pay-as-you-go (PAYG) models which reduce upfront costs. Companies like Lumos and BBOXX are scaling their operations. Furthermore, these business models lower financial barriers and offer flexible, tech-enabled billing.
Egypt and Morocco are gradually positioning themselves as Africa’s green hydrogen hubs. For instance, in July 2024, Fertiglobe secured a 20-year green ammonia offtake agreement with Hintco in Germany through the first-ever H2Global auction, marking a significant milestone for Scatec ASA's Egypt Green Hydrogen project, which is in collaboration with Fertiglobe, Orascom Construction, The Sovereign Fund of Egypt, and the Egyptian Electricity Transmission Company. Moreover, Morocco has begun integrating green hydrogen into its industrial strategy, with export ambitions to Europe, propelling the Africa renewable energy market growth. This shift is powered by abundant solar and wind resources and a strategic geographic location. Such initiatives diversify Africa’s renewable portfolio while aligning with global decarbonization goals.
Africa is embracing hybrid energy setups combining solar, wind, and storage systems to tackle intermittency and grid instability. The 15 MW Essakane hybrid solar-thermal plant in Burkina Faso powers a gold mine in an off-grid region, blending solar and thermal for round-the-clock output. These models improve energy reliability in remote industries, reduce diesel reliance, and reduce operating costs. They also enable grid-connected regions to stabilise voltage fluctuations. This Africa renewable energy market trend is gaining traction in mining, telecom, and agriculture sectors with 24/7 energy needs.
Floating solar and agrivoltaic systems are opening up lucrative opportunities for African companies. For example, In April 2025, Ghana took a significant stride toward renewable energy with the launch of the largest floating solar plant in West Africa on the Black Volta River. By 2030, the 5MW initiative is aimed to increase the nation's contribution of renewable energy from 1% to 10%. This creative approach conserves water, maximises land use, and is already producing electricity. Similarly, in Kenya, agrivoltaics are used to shade crops while producing solar electricity, boosting agricultural yield. These innovations not only optimise resource use but also create new investment pathways for local developers.
The EMR’s report titled “Africa Renewable Energy Market Report and Forecast 2026-2035” offers a detailed analysis of the market based on the following segments:
Market Breakup by Renewable Energy Type
Key Insight: Hydropower continues to dominate the African industry with long-term infrastructure projects, essential for base-load energy. Solar surges ahead in the market owing to flexibility, suitable for decentralised setups. Wind energy is gaining ground in the Horn of Africa where high wind speeds are untapped. Bioenergy thrives in agricultural economies, converting waste into power. Bagasse is key in sugar-producing nations like Sudan. Solid biofuels power rural cooking needs, while geothermal energy is boosted by Kenya.
Market Breakup by Region
Key Insight: South Africa excels in financing and infrastructure, becoming the go-to market for large-scale IPPs. Egypt is rapidly emerging in the renewable energy market share in Africa with massive solar and hydrogen projects. Growth in Kenya is accelerated by geothermal projects. Ethiopia banks on hydro exports via interconnectors. Morocco’s hybrid projects combine wind and solar for export via Spain. West Africa focuses on decentralised solar for rural access.
By Renewable Energy Type, Hydropower Remains the Dominant Segment of the Market
Hydropower accounts for 68% of the market share. The Grand Ethiopian Renaissance Dam (GERD), with a 6,450 MW capacity, represents Africa’s boldest hydropower ambition. Countries like Angola and DRC are scaling similar projects, leveraging their river basins for transnational energy exports. Hydropower is increasingly coupled with solar in reservoir management to offset dry season downtimes. It also supports grid stabilisation amid growing intermittent renewables.
Solar is currently the fastest-growing type category accelerating the Africa renewable energy market revenue. This renewable energy type is driven by declining panel costs and decentralised deployment models. According to industry reports, solar installations are set to grow by 42% in 2025, with standout progress in Nigeria, South Africa, and Egypt. Innovations like containerised microgrids and floating PV systems are pushing boundaries. For instance, Malawi’s 60 MW Salima Solar project, which is located 75 kilometres east of Lilongwe, the capital of Malawi, currently supplies up to 60MWAC of electricity to the country's national grid and is expected to leverage a USD 91.2 million committed project investment. Distributed solar has also spurred SME growth by powering agro-processing units and ICT hubs.
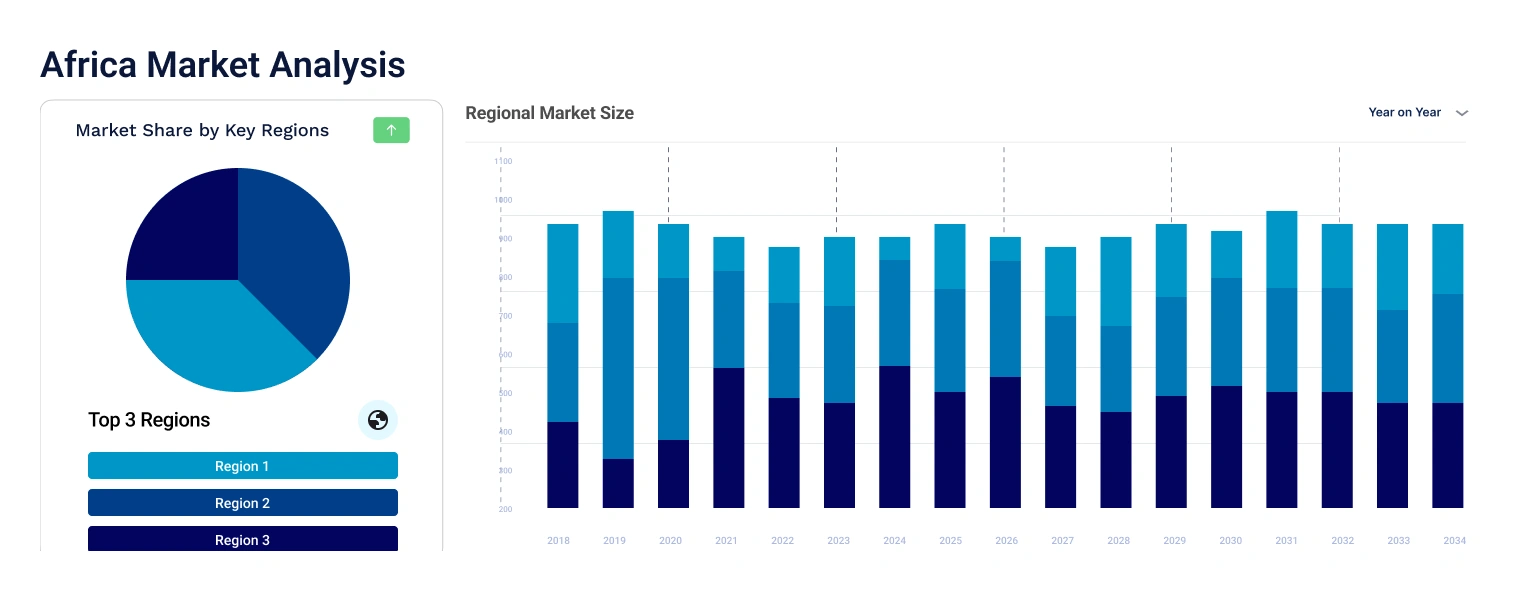
By Region, South Africa Secures the Leading Position in the Market
The dominance of the South African market is anchored by strategic policy frameworks like REIPPPP. The country’s Just Energy Transition Partnership (JETP), a USD 8.5 billion initiative supported by the European Union, aims to phase out coal while boosting renewables. The country’s advanced grid infrastructure and financing ecosystem attract global developers, while local enterprises are increasingly participating in project execution.
The renewable energy market in Egypt represents the fastest developing regional market. The Benban Solar Park with a 1.8 GW capacity, symbolises this growth. In March 2024, Egypt also began integrating green hydrogen into its strategy, signing MOUs for projects totalling over USD 40 billion. The country benefits from high solar irradiance and stable wind conditions in the Gulf of Suez, where several wind farms are underway.
Leading Africa renewable energy market players are focusing on local partnerships, hybrid project capabilities, and energy storage integration. The market observes a strong shift toward bankable models, blending concessional finance with commercial terms, to reduce risk perception. Players are also exploring carbon credit mechanisms and green bond issuances to unlock fresh investments. Additionally, digital tools like smart metering and AI-enabled forecasting are being used to improve efficiency and system stability.
Further, Africa renewable energy companies find opportunities in industrial decarbonisation, mini-grid development, and energy-as-a-service platforms. Some of the key trends that they are focusing on are hybrid systems, off-grid solar, green hydrogen, public-private funding models, and floating solar. Strategic alliances with local utilities, agribusinesses, and technology firms are expected to be crucial. As Africa urbanises and electrifies, firms that offer modular, adaptive, and cost-effective energy solutions are expected to thrive in the coming years.
Established in 1998 and headquartered in Beijing, China, Goldwind has expanded into Africa with a focus on large-scale wind projects. The company supplied turbines for Egypt’s 250 MW Gulf of Suez project. The firm brings high-tech turbine technology and offers local workforce training, ensuring long-term project maintenance. It is targeting countries with coastal and high-altitude wind corridors for future installations.
Formed in 2008 and based in Western Cape, Sustainable Power Solutions provides commercial solar PV and storage solutions across sub-Saharan Africa. The firm’s portfolio includes over 150 installations in retail, mining, and agro-processing. It offers lease-to-own models and integrates IoT systems for energy optimisation, catering to businesses seeking reliable off-grid alternatives.
Founded in 2007 and headquartered in Oslo, Norway, Scatec ASA is a pioneer in utility-scale solar in Africa. The company emphasises sustainability, co-developing with local firms and engaging in long-term power purchase agreements (PPAs). It also focuses on hybrid solutions combining solar with battery storage.
*Please note that this is only a partial list; the complete list of key players is available in the full report. Additionally, the list of key players can be customized to better suit your needs.*
Explore the latest trends shaping the Africa renewable energy market 2026-2035 with our in-depth report. Gain strategic insights, future forecasts, and key market developments that can help you stay competitive. Download a free sample report or contact our team for customised consultation on Africa renewable energy market trends 2026.
United States Renewable Energy Market
Latin America Renewable Energy Market
North America Renewable Energy Market
Saudi Arabia Renewable Energy Market
Asia Pacific Renewable Energy Market
Germany Renewable Energy Market
Mexico Renewable Energy Market
Europe Renewable Energy Market
India Renewable Energy Market


Upto 15% Off
USD
$2499 $2249
$3999 $3599
$4999 $4249
$5999 $5099


*While we strive to always give you current and accurate information, the numbers depicted on the website are indicative and may differ from the actual numbers in the main report. At Expert Market Research, we aim to bring you the latest insights and trends in the market. Using our analyses and forecasts, stakeholders can understand the market dynamics, navigate challenges, and capitalize on opportunities to make data-driven strategic decisions.*
Get in touch with us for a customized solution tailored to your unique requirements and save upto 35%!
In 2025, the Africa renewable energy market attained an installation capacity of nearly 3099.38 Gigawatt.
The market is projected to grow at a CAGR of 6.00% between 2026 and 2035.
Key strategies driving the market include prioritizing hybrid models, forging local joint ventures, customizing solutions per region, leveraging concessional funds, and adopting tech-enabled systems.
Hybrid systems, off-grid solar, green hydrogen, public-private funding models, and floating solar are some of the key trends noticed in the renewable energy market of Africa.
The major regions in the industry are South Africa, Egypt, Ethiopia, and Kenya, among others.
Hydropower, wind, solar, bioenergy, solid biofuels, bagasse, and geothermal are the leading renewable energy types in the industry.
The major players in the industry are Goldwind, Sustainable Power Solutions, and Scatec ASA, among others.
The key challenges are financing gaps, grid instability, policy inconsistencies, and currency volatility.
Explore our key highlights of the report and gain a concise overview of key findings, trends, and actionable insights that will empower your strategic decisions.
| REPORT FEATURES | DETAILS |
| Base Year | 2025 |
| Historical Period | 2019-2025 |
| Forecast Period | 2026-2035 |
| Scope of the Report |
Historical and Forecast Trends, Industry Drivers and Constraints, Historical and Forecast Market Analysis by Segment:
|
| Breakup by Renewable Energy Type |
|
| Breakup by Region |
|
| Market Dynamics |
|
| Competitive Landscape |
|
| Companies Covered |
|
| Report Price and Purchase Option | Explore our purchase options that are best suited to your resources and industry needs. |
| Delivery Format | Delivered as an attached PDF and Excel through email, with an option of receiving an editable PPT, according to the purchase option. |
Datasheet
One User
USD 2,499
USD 2,249
tax inclusive*
Single User License
One User
USD 3,999
USD 3,599
tax inclusive*
Five User License
Five User
USD 4,999
USD 4,249
tax inclusive*
Corporate License
Unlimited Users
USD 5,999
USD 5,099
tax inclusive*
*Please note that the prices mentioned below are starting prices for each bundle type. Kindly contact our team for further details.*
Flash Bundle
Small Business Bundle
Growth Bundle
Enterprise Bundle
*Please note that the prices mentioned below are starting prices for each bundle type. Kindly contact our team for further details.*
Flash Bundle
Number of Reports: 3
20%
tax inclusive*
Small Business Bundle
Number of Reports: 5
25%
tax inclusive*
Growth Bundle
Number of Reports: 8
30%
tax inclusive*
Enterprise Bundle
Number of Reports: 10
35%
tax inclusive*
How To Order

Select License Type
Choose the right license for your needs and access rights.

Click on ‘Buy Now’
Add the report to your cart with one click and proceed to register.

Select Mode of Payment
Choose a payment option for a secure checkout. You will be redirected accordingly.
Gain insights to stay ahead and seize opportunities.

Get insights & trends for a competitive edge.

Track prices with detailed trend reports.

Analyse trade data for supply chain insights.

Leverage cost reports for smart savings

Enhance supply chain with partnerships.

Connect For More Information
Our expert team of analysts will offer full support and resolve any queries regarding the report, before and after the purchase.
Our expert team of analysts will offer full support and resolve any queries regarding the report, before and after the purchase.
We employ meticulous research methods, blending advanced analytics and expert insights to deliver accurate, actionable industry intelligence, staying ahead of competitors.
Our skilled analysts offer unparalleled competitive advantage with detailed insights on current and emerging markets, ensuring your strategic edge.
We offer an in-depth yet simplified presentation of industry insights and analysis to meet your specific requirements effectively.


Share