

Consumer Insights
Uncover trends and behaviors shaping consumer choices today
Procurement Insights
Optimize your sourcing strategy with key market data
Industry Stats
Stay ahead with the latest trends and market analysis.

The Africa online gambling market is projected to grow at a CAGR of 6.60% between 2026 and 2035. The market is being aided by growing smartphone and internet penetration in the region.
Base Year
Historical Period
Forecast Period
In 2021-22, the gross gaming revenue of the gambling sector in South Africa reached R34.4 billion, reflecting a 48% rise compared to the R23.2 billion recorded in the preceding financial year.
It is anticipated that by 2030, Sub-Saharan Africa will reach 226 million subscriptions to 5G mobile networks, indicating an adoption rate of 17%.
The GSMA forecasts that by 2030, more than 1.2 billion smartphones will be operational in Sub-Saharan Africa.
Compound Annual Growth Rate
6.6%
2026-2035
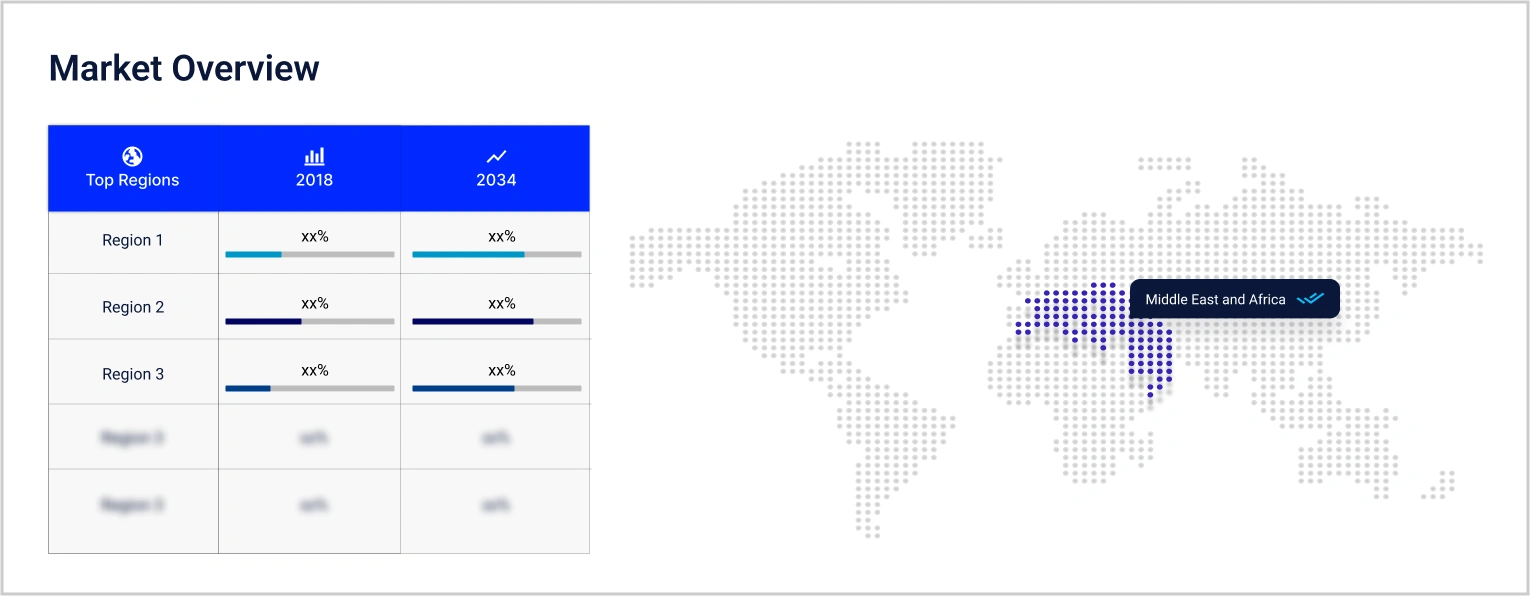
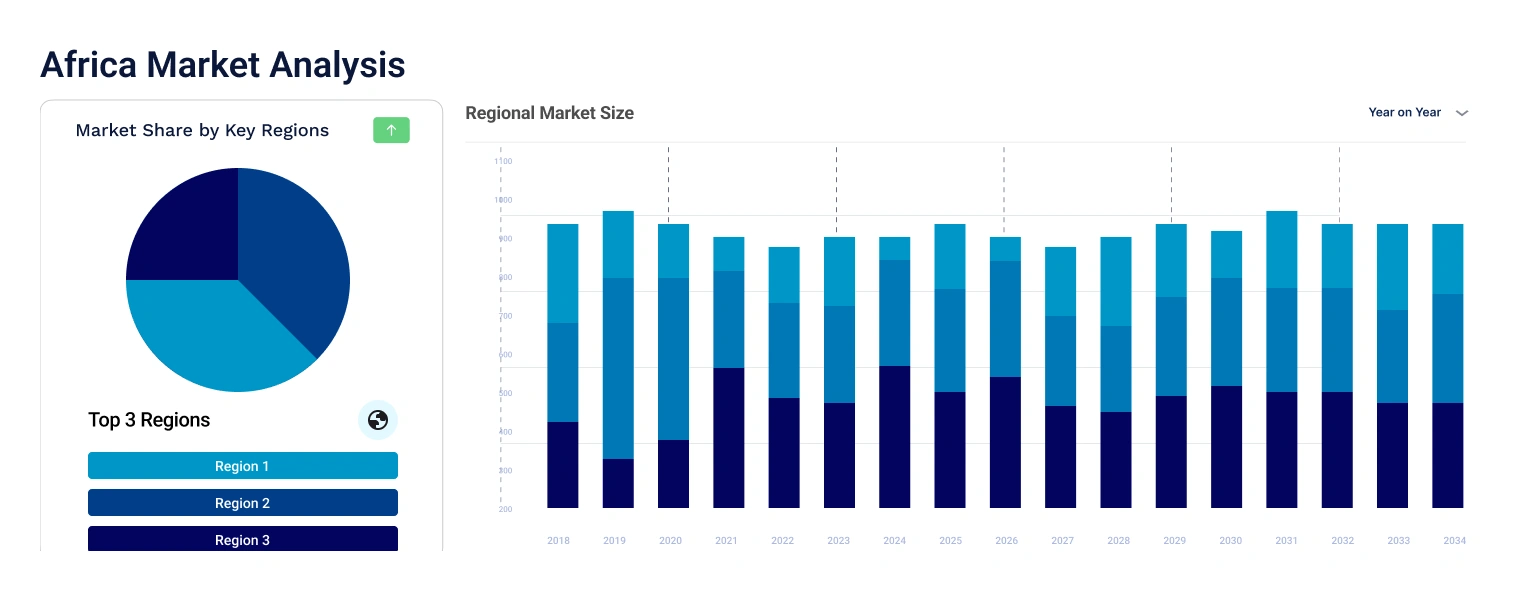
*this image is indicative*
| Africa Online Gambling Market Report Summary | Description | Value |
| Base Year | USD Million | 2025 |
| Historical Period | USD Million | 2019-2025 |
| Forecast Period | USD Million | 2026-2035 |
| Market Size 2025 | USD Million | XX |
| Market Size 2035 | USD Million | XX |
| CAGR 2019-2025 | Percentage | XX% |
| CAGR 2026-2035 | Percentage | 6.60% |
| CAGR 2026-2035 - Market by Type | Sports Betting | 7.5% |
| CAGR 2026-2035 - Market by Device | Mobile | 7.3% |
It is projected that mobile phone penetration in Africa will attain 88% by 2030. Additionally, according to GSMA data on the Mobile Economy 2023 in Sub-Saharan Africa, smartphone adoption reached 51% in 2023. The increasing ownership of smartphones, particularly in nations such as Nigeria, Kenya, and South Africa, is driving the expansion of mobile gambling, as users can conveniently engage in online betting via mobile applications. As smartphones become more affordable and internet access becomes more prevalent, a greater segment of the population is able to participate in online gambling from virtually any location at any time, thus making it highly accessible to individuals who may lack access to computers or traditional betting venues.
The integration of 4G and 5G technologies is profoundly influencing the market by improving connectivity, enhancing user experience, and increasing accessibility. In 2022, Sub-Saharan Africa recorded 980 million mobile subscriptions, with nearly 22% utilising 4G technology. Projections indicate that by 2030, this percentage will rise to 66% of mobile subscribers being connected to either 4G or 5G networks. According to Ericsson, the total number of mobile subscriptions (SIM connections) in the region is anticipated to grow to 1.13 billion by 2029, an increase from 900 million in 2022, reflecting an annual growth rate of 3%.
Both 4G and 5G technologies provide significantly enhanced data transfer speeds, facilitating smoother gameplay, expedited betting processes, and real-time updates. This advancement is especially advantageous for live betting and online casino games, where a seamless experience is essential for maintaining user engagement.
Increased internet penetration, rising smartphone adoption, growing disposable income, the growing popularity of sports betting, the influence of international operators, and technological advancements are the major trends impacting the Africa online gambling market growth.
The rapid economic expansion in significant areas, along with a rise in disposable income, is resulting in heightened expenditure on leisure pursuits, such as online gambling.
The immense enthusiasm for sports, especially football, has contributed to the swift increase of sports betting across Africa, thereby facilitating the growth of online gambling platforms.
Advancements in digital payment technologies, such as mobile money and electronic wallets, are facilitating more straightforward processes for users to deposit and withdraw funds, thereby improving the convenience of online gambling.
The expansion of international online gambling firms into the African market is fostering growth within the sector by offering enhanced platforms, a wider variety of games, and more appealing incentives for users.
Growing internet access across the continent, particularly with the expansion of mobile broadband, is making online gambling more accessible to a larger population.
The increasing smartphone ownership, particularly in nations such as Nigeria, Kenya, and South Africa, is driving the expansion of mobile gambling, enabling users to conveniently engage in online betting via mobile applications.
As countries like Nigeria, Kenya, and South Africa experience growth in their economies, there is a corresponding rise in disposable income among the population. This increase in financial resources allows individuals to allocate more funds towards recreational activities, including online gambling. The cultural acceptance of gambling, combined with the allure of potential financial gains, further encourages participation in mobile betting. Additionally, the rise of social media and digital marketing strategies has played a pivotal role in promoting mobile gambling platforms. Operators are leveraging these channels to reach a wider audience, offering enticing promotions and bonuses that appeal to new users.
Africa Online Gambling Market Report and Forecast 2026-2035 offers a detailed analysis of the market based on the following segments:
Market Breakup by Type
Market Breakup by Device
Market Breakup by Country
| CAGR 2026-2035 - Market by | Type |
| Sports Betting | 7.5% |
| Others | 5.9% |
| Casinos | XX% |
| Poker | XX% |
| Lottery | XX% |
| CAGR 2026-2035 - Market by | Device |
| Mobile | 7.3% |
| Desktop | XX% |
Based on the device, the market is segmented into desktop and mobile. The mobile segment is projected to grow at a CAGR of 7.3% during the forecast period of 2026-2035. The adoption of mobile devices for online gambling has surged significantly in recent years, propelled by technological innovations and evolving consumer preferences.
Major players are focusing on facilitating improved user experience to gain a competitive edge in the market.
The comprehensive report looks into the macro and micro aspects of the market. The EMR report gives an in-depth insight into the market by providing a SWOT analysis as well as an analysis of Porter’s Five Forces model.
Australia Online Gambling Market


Upto 15% Off
USD
$3999 $3599
$2499 $2249
$4999 $4249
$5999 $5099


*While we strive to always give you current and accurate information, the numbers depicted on the website are indicative and may differ from the actual numbers in the main report. At Expert Market Research, we aim to bring you the latest insights and trends in the market. Using our analyses and forecasts, stakeholders can understand the market dynamics, navigate challenges, and capitalize on opportunities to make data-driven strategic decisions.*
Get in touch with us for a customized solution tailored to your unique requirements and save upto 35%!
The market is assessed to grow at a CAGR of 6.60% between 2026 and 2035.
The market is being driven by increased internet penetration, rising smartphone adoption, and growing disposable income in the region.
The key trends aiding the market expansion include the rising popularity of sports betting in the region and the influence of international operators on the African market.
The major devices for online gambling are desktop and mobile.
The major countries considered in the market are Zambia, Nigeria, Kenya, Rwanda, Ghana, and Uganda, among others.
The major players in the market are KC Gaming Networks Limited, Caecus N.V., SV Gaming Limited, NairaBET, Shop and Deliver Limited, Mchezo Limited, EU Lotto Ltd., and Africabet International BV, among others.
Explore our key highlights of the report and gain a concise overview of key findings, trends, and actionable insights that will empower your strategic decisions.
| REPORT FEATURES | DETAILS |
| Base Year | 2025 |
| Historical Period | 2019-2025 |
| Forecast Period | 2026-2035 |
| Scope of the Report |
Historical and Forecast Trends, Industry Drivers and Constraints, Historical and Forecast Market Analysis by Segment
|
| Breakup by Type |
|
| Breakup by Device |
|
| Breakup by Region |
|
| Market Dynamics |
|
| Competitive Landscape |
|
| Companies Covered |
|
Single User License
One User
USD 3,999
USD 3,599
tax inclusive*
Datasheet
One User
USD 2,499
USD 2,249
tax inclusive*
Five User License
Five User
USD 4,999
USD 4,249
tax inclusive*
Corporate License
Unlimited Users
USD 5,999
USD 5,099
tax inclusive*
*Please note that the prices mentioned below are starting prices for each bundle type. Kindly contact our team for further details.*
Flash Bundle
Small Business Bundle
Growth Bundle
Enterprise Bundle
*Please note that the prices mentioned below are starting prices for each bundle type. Kindly contact our team for further details.*
Flash Bundle
Number of Reports: 3
20%
tax inclusive*
Small Business Bundle
Number of Reports: 5
25%
tax inclusive*
Growth Bundle
Number of Reports: 8
30%
tax inclusive*
Enterprise Bundle
Number of Reports: 10
35%
tax inclusive*
How To Order

Select License Type
Choose the right license for your needs and access rights.

Click on ‘Buy Now’
Add the report to your cart with one click and proceed to register.

Select Mode of Payment
Choose a payment option for a secure checkout. You will be redirected accordingly.
Gain insights to stay ahead and seize opportunities.

Get insights & trends for a competitive edge.

Track prices with detailed trend reports.

Analyse trade data for supply chain insights.

Leverage cost reports for smart savings

Enhance supply chain with partnerships.

Connect For More Information
Our expert team of analysts will offer full support and resolve any queries regarding the report, before and after the purchase.
Our expert team of analysts will offer full support and resolve any queries regarding the report, before and after the purchase.
We employ meticulous research methods, blending advanced analytics and expert insights to deliver accurate, actionable industry intelligence, staying ahead of competitors.
Our skilled analysts offer unparalleled competitive advantage with detailed insights on current and emerging markets, ensuring your strategic edge.
We offer an in-depth yet simplified presentation of industry insights and analysis to meet your specific requirements effectively.


Share