

Consumer Insights
Uncover trends and behaviors shaping consumer choices today
Procurement Insights
Optimize your sourcing strategy with key market data
Industry Stats
Stay ahead with the latest trends and market analysis.

The global 3D scanning market attained a value of USD 6552.66 Million in 2025. The market is estimated to grow at a CAGR of 11.40% during 2026-2035 to reach a value of USD 19287.22 Million by 2035.
Base Year
Historical Period
Forecast Period
According to 2024 data, global construction volume will grow by 1.2%, witnessing a 3% annual average over the rest of the decade.
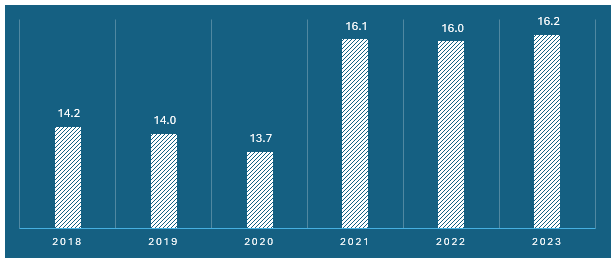
A total of 14.2 million new Battery Electric Vehicles (BEV) and Plug-in Hybrids (PHEV) were delivered globally in 2023.
By 2030, the volume of global construction output is expected to grow by 85% to USD 15.5 trillion.
Compound Annual Growth Rate
11.4%
Value in USD Million
2026-2035
*this image is indicative*
In the automotive sector, 3D scanning is used for sophisticated applications, enabling detailed car models and quality control of components. In 2023, the global automotive production witnessed a 10% growth compared to 2022. In the aerospace sector, industrial 3D scanning is crucial to creating 3D drawings of various aircraft components with intricate details and complex geometric features. In 2022, Airbus delivered 661 commercial aircraft to 84 customers, an 8% increase compared to 2021, and Boeing delivered 774 commercial orders globally.
Read more about this report - REQUEST FREE SAMPLE COPY IN PDF
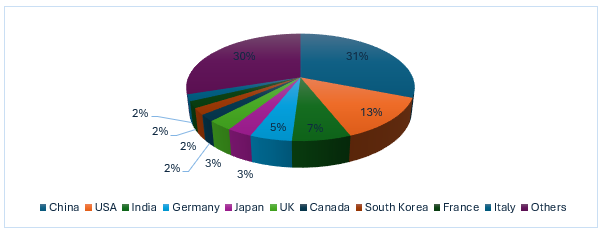
According to the World Bank, value added by the manufacturing sector as a percentage of GDP all across the globe was 15.0% in 2023. Moreover, in 2023, the global manufacturing sector generated about USD 16.2 trillion in annual revenue. According to 2024 data, China boasts the largest manufacturing sector globally, producing about 31.6% of global manufacturing output. In the manufacturing sector, 3D scanning software helps businesses enhance the quality and efficiency of inspections by creating detailed 3D models of manufactured items.
Figure: Global Manufacturing, Value Added (USD Trillion), 2019-2025
The global 3D scanning market is supported by the heightened demand from the construction sector. The global construction sector is driven by the increasing government spending on infrastructure, and the rising urban population in emerging markets such as China and India. By 2050, the rate of urbanization, globally, is expected to reach around 68% compared to 55% in 2018. In 2022, the Construction Index’s top 100 companies, including Balfour Beatty Plc, Kier Group Plc, and Amey UK Plc., among others, generated a revenue of USD 74.2 billion.
The USA’s construction market is growing, driven by the Inflation Reduction Act passed in 2022 which is attracting investment in manufacturing and mega infrastructural projects.
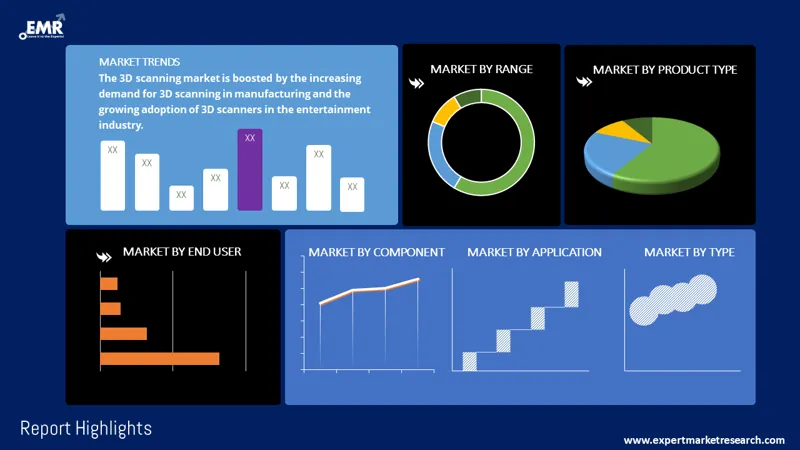
Rising adoption in the manufacturing sector; technological advancements; expansion of the construction sector; and improved measurement efficiency with 3D scanning technology are the key trends impacting the 3D scanning market demand
Using 3D scanning, manufacturers can create a digital model of a part or assembly. By comparing this model with an original CAD/digital model, manufacturers can perform quality control checks to ensure the assembly meet design parameters. In 2023, the global manufacturing sector accounted for 15% of the global GDP, and in Q4 2023, the sector output grew by 1.5% compared to Q4 2022.
The incorporation of automation and robotics has improved the 3D scanning technology by introducing real-time scanning and feedback, and improvements in accuracy and resolution. Automated 3D scanners offer great flexibility and efficiency in quality control.
3D scanning creates a digital model of the site that helps to obtain crucial construction site information. By 2037, the top 10 construction markets, including China, the USA, and India are projected to attain a value of USD 9.7 trillion, driven by growing urbanization and investment in infrastructure development.
High measurement precision results in improved outcomes for product design, quality control, and reverse engineering. Traditional measurement and inspection methods, such as manual measurements and basic CAD drawings can be labor-intensive and time-consuming. In contrast, 3D scanners simplify these processes, drastically decreasing the time needed to capture data from complex shapes and geometries. This increased efficiency leads to faster product development cycles, lower labor costs, and ultimately a quicker time-to-market for new products.
3D scanning is extensively used in the automotive sector for creating detailed car models and ensuring quality control of components. It provides high-precision measurements, enabling the detection of even minor deviations from specifications. The detailed visualization of geometric models allows manufacturers to identify defects and optimize designs, supporting timely deliveries. The increasing popularity of electric vehicles is boosting the market, with the global electric car stock projected to grow from 16.5 million in 2021 to nearly 350 million by 2030.
AI can assist in aligning and merging multiple scans from various angles or sources to produce a cohesive digital model. Additionally, it can classify and categorize scanned objects based on user-defined criteria, such as shape or colour, thereby minimizing the manual effort needed to refine a model.
Read more about this report - REQUEST FREE SAMPLE COPY IN PDF
“Global 3D Scanning Market Report and Forecast 2026-2035” offers a detailed analysis of the market based on the following segments:
Market Breakup by Product Type
Market Breakup by Range
Market Breakup by Component
Market Breakup by Type
Market Breakup by Application
Market Breakup by End User
Market Breakup by Region
Based on end user, the manufacturing sector accounts for a significant share of the market
The adoption of 3D scanning streamlines the manufacturing processes by capturing the precise dimensions, geometries and surface data of physical objects and converting them into accurate representations. The presence of initiatives such as Industry 4.0, that enables the digital transformation of manufacturing sector is supporting the market for 3D scanning. According to the United Nations, in 2022, the global manufacturing value added (MVA) per capita increased to USD 1,879. Europe and North America reached USD 5,093 in 2022.
In 2022, the global defence expenditure surpassed USD 2.24 trillion. The increasing defence spending across the globe is further supporting the market growth. The military and aerospace sector is undergoing a significant transformation with the adoption of 3D scanning for a wide range of purposes including maintenance, repair, and overhaul (MRO) processes, damage assessments, and reverse engineering of parts.
Based on range, the short-range is a major contributor to the global 3D scanning market revenue
Short-range 3d scanning provides increased flexibility in manufacturing processes, pattern making, and quality control. The technologies adopted for short-range scanning are handheld scanners, structured light scanners, laser trackers, laser scanners, PCMMS and fixed-position CMMs.
Phase shift 3d scanners work at shorter ranges from 80 to 120 meters maximum, with a typical operating range of 1 to 50 meters. Phase-shift 3D scanners are also being used as medium-range scanners in automobiles, large pumps, and industrial equipment. The scanners capture data points by rotating 360 degrees using a spinning mirror to direct the laser outward toward the objects or areas being 3D scanned.


Rising automotive production in the USA and Canada drives the demand for 3D scanning to enable the creation of highly detailed car models. In 2023 USA’s and Canada’s automotive production expanded by 6% and 26% year-on-year, respectively.
APAC’s light vehicle production expanded nearly 10% year-on-year (YoY) in 2023 to 51.8 million units driven by automotive production in China, Japan, Korea, and India. In 2022, APAC's construction sector generated about USD 4.36 trillion, representing 45% of the global construction industry.
EU infrastructure volumes experienced moderate growth, rising by 2.4% in 2022 and 3.2% in 2023. By 2026, Europe is projected to complete approximately 1.5 million housing units. Additionally, civil engineering in Europe is anticipated to grow by 7.5% by 2026 from 2023.
The market players are focused on providing products at competitive prices and high quality, with improved customer service, product support, and performance features.
Headquartered in the United States, Autodesk is a global leader in 3D design, engineering, and entertainment technology solutions, spanning architecture, engineering, construction, product design, manufacturing, media, and entertainment.
Founded in 1986, the company offers solutions with advanced applications in its industry verticals including Healthcare Solutions (medical devices, personalized services, and regenerative medicine) and Industrial Solutions (defence, and general manufacturing)
Nikon Metrology is a part of the Nikon group. Based in Belgum, the company offers an innovative metrology product portfolio, including optical inspection and mechanical 3D metrology solutions complemented with state-of-the-art vision measuring instruments and microscopes.
FARO Technologies is a global leader in the design, development, manufacturing, marketing, and support of software-driven 3D measurement, imaging, and realization solutions. Founded in 1982, the company’s products cater to various sectors, including manufacturing, architecture, engineering, and construction (AEC), operations and maintenance (O&M), and public safety analytics.
*Please note that this is only a partial list; the complete list of key players is available in the full report. Additionally, the list of key players can be customized to better suit your needs.*
Other notable players operating in the global 3D scanning market are Creaform Inc, Topcon Corporation, Hexagon AB, Evatronix SA, Artec Europe, S.à.r.l, ShapeGrabber Inc., Maptek Pty Limited, Scantech (Hangzhou) Co., Ltd, among others.


Upto 15% Off
USD
$2499 $2249
$3999 $3599
$4999 $4249
$5999 $5099


*While we strive to always give you current and accurate information, the numbers depicted on the website are indicative and may differ from the actual numbers in the main report. At Expert Market Research, we aim to bring you the latest insights and trends in the market. Using our analyses and forecasts, stakeholders can understand the market dynamics, navigate challenges, and capitalize on opportunities to make data-driven strategic decisions.*
Get in touch with us for a customized solution tailored to your unique requirements and save upto 35%!
The global market for 3D scanning attained a value of USD 6552.66 Million in 2025.
The market is estimated to grow at a CAGR of 11.40% during 2026-2035.
The market is estimated to witness a healthy growth in the forecast period of 2026-2035 to reach a value of USD 19287.22 Million by 2035.
The factors driving the market growth are rising technological advancements, expansion of the construction sector, and the rising demand from the automotive and aerospace sectors.
The market is projected to be propelled by the increasing research and development activities, the growing requirement for quality control of products, and the rising preference for sustainable products.
The key regional markets for 3D scanning are North America, Europe, the Asia Pacific, Latin America, and the Middle East and Africa.
The different components of 3D scanning are hardware, software, and services.
The various product types in the market include optical scanners, laser scanners, and structured light scanners, among others.
The significant ranges of 3D scanning considered in the market report include short range, medium range, and long range.
Tripod mounted, fixed, portable, and desktop are the various types of 3D scanning.
The applications include reverse engineering, quality control and inspection, face/body scanning, virtual simulation, and others.
The end users include aerospace and defence, manufacturing, automotive, healthcare, architecture and construction, and others.
The key players in the market include Autodesk Inc., 3D Systems, Inc., Nikon Metrology NV, FARO Technologies, Inc, Creaform Inc, Topcon Corporation, Hexagon AB, Evatronix SA, Artec Europe, S.à.r.l, ShapeGrabber Inc., Maptek Pty Limited, and Scantech (Hangzhou) Co., Ltd, among others.
Explore our key highlights of the report and gain a concise overview of key findings, trends, and actionable insights that will empower your strategic decisions.
| REPORT FEATURES | DETAILS |
| Base Year | 2025 |
| Historical Period | 2019-2025 |
| Forecast Period | 2026-2035 |
| Scope of the Report |
Historical and Forecast Trends, Industry Drivers and Constraints, Historical and
|
| Breakup by Product Type |
|
| Breakup by Range |
|
| Breakup by Component |
|
| Breakup by Type |
|
| Breakup by Application |
|
| Breakup by End User |
|
| Breakup by Region |
|
| Market Dynamics |
|
| Competitive Landscape |
|
| Companies Covered |
|
| Report Price and Purchase Option | Explore our purchase options that are best suited to your resources and industry needs. |
| Delivery Format | Delivered as an attached PDF and Excel through email, with an option of receiving an editable PPT, according to the purchase option. |
Datasheet
One User
USD 2,499
USD 2,249
tax inclusive*
Single User License
One User
USD 3,999
USD 3,599
tax inclusive*
Five User License
Five User
USD 4,999
USD 4,249
tax inclusive*
Corporate License
Unlimited Users
USD 5,999
USD 5,099
tax inclusive*
*Please note that the prices mentioned below are starting prices for each bundle type. Kindly contact our team for further details.*
Flash Bundle
Small Business Bundle
Growth Bundle
Enterprise Bundle
*Please note that the prices mentioned below are starting prices for each bundle type. Kindly contact our team for further details.*
Flash Bundle
Number of Reports: 3
20%
tax inclusive*
Small Business Bundle
Number of Reports: 5
25%
tax inclusive*
Growth Bundle
Number of Reports: 8
30%
tax inclusive*
Enterprise Bundle
Number of Reports: 10
35%
tax inclusive*
How To Order

Select License Type
Choose the right license for your needs and access rights.

Click on ‘Buy Now’
Add the report to your cart with one click and proceed to register.

Select Mode of Payment
Choose a payment option for a secure checkout. You will be redirected accordingly.
Gain insights to stay ahead and seize opportunities.

Get insights & trends for a competitive edge.

Track prices with detailed trend reports.

Analyse trade data for supply chain insights.

Leverage cost reports for smart savings

Enhance supply chain with partnerships.

Connect For More Information
Our expert team of analysts will offer full support and resolve any queries regarding the report, before and after the purchase.
Our expert team of analysts will offer full support and resolve any queries regarding the report, before and after the purchase.
We employ meticulous research methods, blending advanced analytics and expert insights to deliver accurate, actionable industry intelligence, staying ahead of competitors.
Our skilled analysts offer unparalleled competitive advantage with detailed insights on current and emerging markets, ensuring your strategic edge.
We offer an in-depth yet simplified presentation of industry insights and analysis to meet your specific requirements effectively.


Share