

Consumer Insights
Uncover trends and behaviors shaping consumer choices today
Procurement Insights
Optimize your sourcing strategy with key market data
Industry Stats
Stay ahead with the latest trends and market analysis.
According to the urea procurement report, global urea consumption is seeing substantial growth, driven by its extensive use in agricultural services as a nitrogen-based fertilizer to enhance crop yields and meet the increasing food demand due to a growing population. Urea contains 46% nitrogen. With the global population projected to reach approximately 9.7 billion by 2050, up from 8 billion in 2022, the demand for food and category management is expected to rise.
Base Year
Historical Period
Forecast Period


The pricing models of urea is mainly influenced by its increasing industrial applications, such as in the production of urea-formaldehyde resins and melamine. Urea-formaldehyde resins are widely used as adhesives in wood products, coatings, equipment, and molded items. As per the urea procurement market report, these resins are also applied in textiles, paper industries, and as slow-release fertilizers. According to 2024 data, the world's top textile-producing countries generate textiles valued at $592,800 million, influencing pricing strategies. China and Bangladesh together account for about 60% of global textile production.
According to the urea procurement report, the expanding agricultural and industrial sectors in the Asia Pacific region, particularly in China, are driving the demand for negotiation strategies. In 2023, China, as the world’s largest producer of urea, was responsible for approximately one-third of the global supply of this nitrogen-based fertilizer.
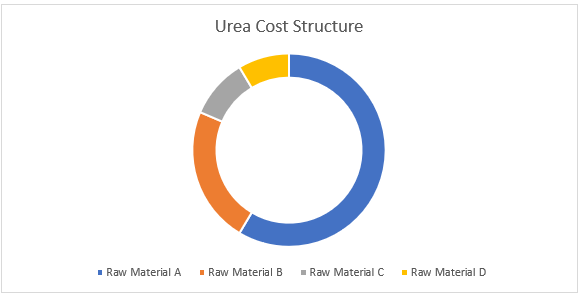
According to the urea procurement report, the cost modeling of urea production is influenced by several key factors, such as raw materials, energy, catalysts, operational expenses, and regulatory requirements. Natural gas or coal reserves serve as the main feedstock, making up about 80% of production costs. Other major expenses include plant operations, equipment, labor, and maintenance. Additionally, capital expenditures for production facilities and equipment depreciation contribute to the overall costs, as highlighted in procurement research.
Transportation and logistics costs, especially for international exports, play a role in shaping pricing strategies. As companies implement sustainable practices, the costs of environmental compliance and regulations have become more significant. According to urea sourcing, market-specific factors like subsidies, tariffs, and currency fluctuations can also affect cost modeling in different regions.
According to the urea procurement report, urea pricing trends are shaped by factors such as the global need for agricultural fertilizers, influenced by crop production cycles and food security concerns. Raw material costs, especially natural gas, play a significant role due to its use in urea production. Seasonal demand variations, government subsidies, and export restrictions from major producers like China impact negotiation strategies.
Energy price fluctuations, transportation and equipment costs, and geopolitical tensions also contribute to market dynamics, as mentioned in the urea procurement report. Additionally, industrial demand for urea in sectors like chemical manufacturing affects prices. Tracking these factors is crucial for understanding and forecasting urea pricing models.
According to the urea procurement report, the urea industry emphasizes securing dependable supply chains, implementing effective pricing strategies, and maintaining quality standards. Buyers should assess suppliers based on cost modeling, delivery dependability, and compliance with specifications like nitrogen content and granule size. Long-term agreements or bulk purchasing help reduce price fluctuations. Sustainability factors, such as eco-friendly production methods and certifications, are becoming increasingly important.
Efficient logistics, robust storage capabilities, and flexibility to provide on-demand supplies ensure operational continuity. In line with the urea procurement market report, tracking pricing trends, government regulations, and global trade factors, especially export-import policies, helps optimize procurement strategies and manage risks effectively. Building strategic partnerships with key producers is essential for securing a stable supply.
Founded in 1905 and headquartered in Oslo, Norway, Yara holds a unique position as the industry’s only global crop nutrition company. According to the urea procurement report, the company operates in over 60 countries, with sustainability being a core element of its business model. In 2023, Yara generated revenues of USD 15.5 billion.
Founded in 1967 and headquartered in New Delhi, India, Indian Farmers Fertiliser Cooperative Limited (IFFCO) is primarily engaged in the production and distribution of fertilisers and offering substantial contributions to the efforts of the Indian Government to increase foodgrain production in the country.
Founded in 1977 and headquartered in Indonesia, PT Pupuk Kalimantan Timur (PKT) is one of the largest Urea and NPK producers in Asia. According to the urea procurement report, Pupuk Kaltim currently operates 13 plants, including 5 ammonia plants with a capacity of 2.74 million tons per year, 5 urea plants with a capacity of 3.43 million tons per year, and 3 NPK plants with a capacity of 300,000 tons per year.
Founded in 1974 and headquartered in India, National Fertilisers Limited (NFL) is the second largest producer of the key fertiliser urea in India with an installed capacity of 35.68 lakh MT with a 16% share in total urea production of country.
Headquartered in Switzerland, EuroChem is one of only three companies in the world with in-house production capacity across all three essential plant nutrient groups including nitrogen, phosphate, and potash. According to the urea procurement report, the company manufactures nitrogen, phosphate, and NPK fertilizers.
*Please note that this is only a partial list; the complete list of key players is available in the full report. Additionally, the list of key players can be customized to better suit your needs.*
*While we strive to always give you current and accurate information, the numbers depicted on the website are indicative and may differ from the actual numbers in the main report. At Expert Market Research, we aim to bring you the latest insights and trends in the market. Using our analyses and forecasts, stakeholders can understand the market dynamics, navigate challenges, and capitalize on opportunities to make data-driven strategic decisions.*
Get in touch with us for a customized solution tailored to your unique requirements and save upto 35%!
The market reached a volume of 177.21 MMT in 2024.
As per urea procurement report the industry is projected to grow at a CAGR of 1.70% between 2025 and 2030.
The urea procurement market is projected to grow to 196.07 MMT by 2030.
The global urea consumption is experiencing significant growth, driven by its widespread applications in the agricultural sector and its use in the production of urea-formaldehyde resins and melamine.
By application, the industry is divided into fertiliser, urea formaldehyde (UF) and melamine resins, melamine (Cyanurates), and animal feed, among others.
The primary raw materials for producing urea are ammonia and carbon dioxide. Ammonia is typically derived from natural gas, while carbon dioxide is often obtained as a byproduct from industrial processes, such as the production of ammonia.
Procurement best practices focus on building long-term relationships with raw material suppliers. Fixed pricing agreements help manage price fluctuations, and suppliers are evaluated on their delivery reliability, storage capacity, and adherence to quality standards, especially in agricultural applications.
The competitive landscape consists of Yara International, Indian Farmers Fertiliser Cooperative Limited, PT Pupuk Kalimantan Timur, Qatar Fertiliser Company (QAFCO), National Fertilisers Limited, EuroChem Group, SABIC Agri-Nutrients, CF Industries Holdings, Inc., Nutrien Ltd., and Koch, Inc., among others.
The market is broken down into North America, Latin America, EMEA, APAC.
Explore our key highlights of the report and gain a concise overview of key findings, trends, and actionable insights that will empower your strategic decisions.
| REPORT FEATURES | DETAILS |
| Base Year | 2024 |
| Historical Period | 2019-2024 |
| Forecast Period | 2025-2030 |
| Growth Rate | CAGR of 1.70 from 2025 to 2030 |
| Regional Cost Structure | Key Cost Indicators, Cost Breakdown by Component |
| Raw Material Market Outlook | Raw Material Market Analysis, Mapping of Key Raw Material Suppliers, Availability of Raw Material by Region, Pricing Outlook of Key Raw Materials |
| Key Sourcing Strategies | Vendor/Supplier Selection, Price and Contract Model Structure, Sourcing Model, Negotiation Strategy |
| Supplier Analysis | Supplier Selection, Key Global Players, Key Regional Players, Supplier Profiles and SWOT Analysis, Innovation and Sustainability |
| Companies Covered | Yara International, Indian Farmers Fertiliser Cooperative Limited, PT Pupuk Kalimantan Timur, Qatar Fertiliser Company (QAFCO), National Fertilisers Limited, EuroChem Group, SABIC Agri-Nutrients, CF Industries Holdings, Inc., Nutrien Ltd., and Koch, Inc., among others. |
Datasheet
One User
USD 2,999
USD 2,699
tax inclusive*
Single User License
One User
USD 4,399
USD 3,959
tax inclusive*
Five User License
Five User
USD 5,599
USD 4,759
tax inclusive*
Corporate License
Unlimited Users
USD 6,659
USD 5,660
tax inclusive*
*Please note that the prices mentioned below are starting prices for each bundle type. Kindly contact our team for further details.*
Flash Bundle
Small Business Bundle
Growth Bundle
Enterprise Bundle
*Please note that the prices mentioned below are starting prices for each bundle type. Kindly contact our team for further details.*
Flash Bundle
Number of Reports: 3
20%
tax inclusive*
Small Business Bundle
Number of Reports: 5
25%
tax inclusive*
Growth Bundle
Number of Reports: 8
30%
tax inclusive*
Enterprise Bundle
Number of Reports: 10
35%
tax inclusive*
How To Order
Our step-by-step guide will help you select, purchase, and access your reports swiftly, ensuring you get the information that drives your decisions, right when you need it.

Select License Type
Choose the right license for your needs and access rights.

Click on ‘Buy Now’
Add the report to your cart with one click and proceed to register.

Select Mode of Payment
Choose a payment option for a secure checkout. You will be redirected accordingly.
Track prices with detailed trend reports.

Analyse trade data for supply chain insights.

Leverage cost reports for smart savings

Enhance supply chain with partnerships.

Gain insights to stay ahead and seize opportunities.

Get insights & trends for a competitive edge.

Track prices with detailed trend reports.
Analyse trade data for supply chain insights.
Leverage cost reports for smart savings
Enhance supply chain with partnerships.
Gain insights to stay ahead and seize opportunities.
Get insights & trends for a competitive edge.
Track prices with detailed trend reports.
Analyse trade data for supply chain insights.
Connect For More Information
Our expert team of analysts will offer full support and resolve any queries regarding the report, before and after the purchase.
Our expert team of analysts will offer full support and resolve any queries regarding the report, before and after the purchase.
We employ meticulous research methods, blending advanced analytics and expert insights to deliver accurate, actionable industry intelligence, staying ahead of competitors.
Our skilled analysts offer unparalleled competitive advantage with detailed insights on current and emerging markets, ensuring your strategic edge.
We offer an in-depth yet simplified presentation of industry insights and analysis to meet your specific requirements effectively.
Australia
63 Fiona Drive, Tamworth, NSW
+61-448-061-727
India
C130 Sector 2 Noida, Uttar Pradesh 201301
+91-723-689-1189
Philippines
40th Floor, PBCom Tower, 6795 Ayala Avenue Cor V.A Rufino St. Makati City,1226.
+63-287-899-028, +63-967-048-3306
United Kingdom
6 Gardner Place, Becketts Close, Feltham TW14 0BX, Greater London
+44-753-713-2163
United States
30 North Gould Street, Sheridan, WY 82801
+1-415-325-5166
Vietnam
193/26/4 St.no.6, Ward Binh Hung Hoa, Binh Tan District, Ho Chi Minh City
+84-865-399-124
United States (Head Office)
30 North Gould Street, Sheridan, WY 82801
+1-415-325-5166
Australia
63 Fiona Drive, Tamworth, NSW
+61-448-061-727
India
C130 Sector 2 Noida, Uttar Pradesh 201301
+91-723-689-1189
Philippines
40th Floor, PBCom Tower, 6795 Ayala Avenue Cor V.A Rufino St. Makati City, 1226.
+63-287-899-028, +63-967-048-3306
United Kingdom
6 Gardner Place, Becketts Close, Feltham TW14 0BX, Greater London
+44-753-713-2163
Vietnam
193/26/4 St.no.6, Ward Binh Hung Hoa, Binh Tan District, Ho Chi Minh City
+84-865-399-124


Share