

Consumer Insights
Uncover trends and behaviors shaping consumer choices today
Procurement Insights
Optimize your sourcing strategy with key market data
Industry Stats
Stay ahead with the latest trends and market analysis.

The global salt consumption continues to grow due to its essential role in food preservation, seasoning, and industrial processes. Salt is a key ingredient in processed foods, beverages, and snacks, where it enhances flavour and acts as a preservative. Additionally, its demand is rising in industries such as chemicals, where it's used in the production of chlorine and caustic soda, vital components in numerous industrial applications.
Base Year
Historical Period
Forecast Period
A major driver of salt procurement report is its use in de-icing roads during winter months, particularly in regions with harsh climates. As climate change leads to unpredictable weather patterns, the production of salt for de-icing is expected to rise to meet the growing demand. Additionally, with the global population continuing to grow, the consumption of salt in food processing and healthcare applications, such as saline solutions, is also on the rise. This increase in both production and consumption is expected to continue as the need for salt in these essential sectors grows.
On the supply side, salt production is primarily driven by mining and evaporation methods. According to the salt procurement report, advances in brine extraction technologies have improved production efficiency, but the industry faces challenges like water scarcity in key salt-producing regions and fluctuations in raw material costs. Additionally, the rising environmental concerns regarding mining practices have led to a push for more sustainable methods of salt production.
The cost structure of salt is shaped by several key factors, primarily production methods, raw material availability, and logistical expenses. Salt production in the salt procurement report is predominantly achieved through two methods: mining and evaporation. Mining, which involves extracting salt from underground deposits, often incurs higher operational costs due to the need for specialized equipment, labour, and safety measures. This method is commonly used for rock salt. In contrast, evaporation, which is typically employed in coastal areas where seawater is abundant, is less expensive as it relies on solar energy to evaporate water, leaving behind salt crystals. While this method is more cost-effective, it is limited by geographical factors and seasonal variations.
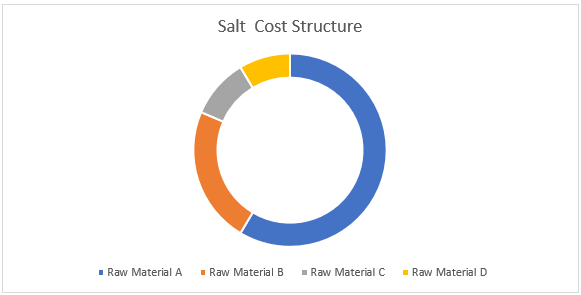
In addition to production costs, transportation plays a significant role in salt's cost modeling. Given its bulk nature and relatively low value, transporting salt can be costly, especially when it needs to be moved over long distances. Fuel prices, infrastructure, and handling costs all contribute to the final pricing models.
Raw material availability also impacts costs in the salt procurement report. Fluctuations in salt deposits or changes in environmental factors, such as droughts affecting evaporation processes, can disrupt supply and lead to price volatility. Ultimately, the cost structure of salt varies depending on the production method, transportation, and environmental factors influencing supply.
Salt price trends in the salt procurement report are influenced by factors such as production costs, demand fluctuations, and weather conditions. In recent years, prices have remained relatively stable, with minor increases driven by rising demand in industrial sectors like chemical production and road de-icing. However, factors such as changes in raw material availability, transportation costs, and environmental impacts, like droughts affecting evaporation processes, can cause price volatility. Additionally, as global consumption rises, particularly in emerging markets, salt prices may see gradual increases, especially if production methods face constraints or increased demand outpaces supply in specific regions.
Procurement best practices in the salt procurement report typically involve sourcing from mining operations or evaporation facilities, depending on the type of salt required. Buyers usually establish long-term contracts with suppliers to ensure a steady supply, competitive pricing and pricing strategies. For industrial use, procurement is often influenced by factors like transportation costs, storage capacity, and regional availability. In food and pharmaceutical sectors, stringent quality standards and certifications are essential, requiring suppliers to meet regulatory guidelines. Procurement strategies may also include bulk purchases to reduce costs or seasonal buying to account for fluctuations in supply and demand, particularly in de-icing and agricultural markets.
Founded in 1865, headquartered in Minnetonka, Minnesota. A multinational food corporation involved in trading, purchasing, and distributing agricultural commodities, producing food ingredients, and providing financial services.
Founded in 1939, headquartered in Mumbai, India. A major player in the salt industry, Tata Chemicals Ltd. produces salt for industrial, food, and agricultural uses. The company is part of the Tata Group and is known for its innovation, sustainability initiatives, and strong distribution network across global markets.
Founded in 1889, headquartered in Kassel, Germany. K+S Aktiengesellschaft is one of the world’s largest salt producers, providing a range of salt products for industrial, food, and de-icing applications. The company is recognized for its global presence and commitment to sustainable production practices.
Founded in 1914, headquartered in Munich, Germany. Wacker Chemie AG is a leading chemical manufacturer that also produces specialty salts for various industries. The company is known for its focus on innovation, sustainability, and high-performance products for sectors including pharmaceuticals, food, and chemicals.
Founded in 1997, headquartered in Beijing, China. China National Salt Industry Corporation (CNSIC) studied in the salt procurement report is the largest salt producer and supplier in China. It specializes in the production, refining, and distribution of various types of salt, including food-grade, industrial, and de-icing salts. As a state-owned enterprise, CNSIC plays a crucial role in China’s salt industry and is involved in both domestic and international markets.
*Please note that this is only a partial list; the complete list of key players is available in the full report. Additionally, the list of key players can be customized to better suit your needs.*


Upto 15% Off
USD
$4399 $3959
$2999 $2699
$5599 $4759
$6659 $5660


*While we strive to always give you current and accurate information, the numbers depicted on the website are indicative and may differ from the actual numbers in the main report. At Expert Market Research, we aim to bring you the latest insights and trends in the market. Using our analyses and forecasts, stakeholders can understand the market dynamics, navigate challenges, and capitalize on opportunities to make data-driven strategic decisions.*
Get in touch with us for a customized solution tailored to your unique requirements and save upto 35%!
The salt market is estimated to be valued at USD 38.93 Billion in 2025.
The salt procurement report is projected to grow at a CAGR of 6.07% between 2026 and 2031.
The salt procurement market report is projected to grow to USD 55.44 Billion by 2031.
The salt production is concentrated in China, United States, India, Australia, Europe.
The global salt consumption is experiencing significant growth, due to its essential role in food preservation, seasoning, and industrial processes.
By type, the market is divided into rock salt, brine, solar salt and vacuum salt.
The primary raw materials used are seawater or natural brine and various rock salt deposits.
The best procurement practices in the salt industry focus on strategic sourcing, quality control, and supply chain resilience. Companies prioritize establishing strong relationships with dependable suppliers, often entering long-term contracts to ensure a steady supply of high-quality salt. Implementing robust quality assurance measures is essential, including regular testing to ensure the salt meets required purity levels and compliance with relevant industry standards. Additionally, companies emphasize risk management by diversifying their supplier base, reducing dependency on a single source, and ensuring operational flexibility in case of market fluctuations or supply chain disruptions.
The competitive landscape consists of Cargill Incorporated, Syensqo SA, Tata Chemical Ltd., K+S Aktiengesellschaft, Wacker Chemie AG, China National Salt Industry Corporation, CIECH S.A., The Salins Group, Compass Minerals International, Inc., Archean Chemical Industries Limited, among others.
The salt procurement market report is broken down into North America, Europe Middle East and Africa, Asia Pacific, and Latin America.
Explore our key highlights of the report and gain a concise overview of key findings, trends, and actionable insights that will empower your strategic decisions.
| REPORT FEATURES | DETAILS |
| Base Year | 2025 |
| Historical Period | 2020-2025 |
| Forecast Period | 2026-2031 |
| Growth Rate | CAGR of 6.07 from 2026 to 2031 |
| Regional Cost Structure | Key Cost Indicators, Cost Breakdown by Component |
| Raw Material Market Outlook | Raw Material Market Analysis, Mapping of Key Raw Material Suppliers, Availability of Raw Material by Region, Pricing Outlook of Key Raw Materials |
| Key Sourcing Strategies | Vendor/Supplier Selection, Price and Contract Model Structure, Sourcing Model, Negotiation Strategy |
| Supplier Analysis | Supplier Selection, Key Global Players, Key Regional Players, Supplier Profiles and SWOT Analysis, Innovation and Sustainability |
| Companies Covered | Cargill Incorporated, Syensqo SA, Tata Chemical Ltd., K+S Aktiengesellschaft, Wacker Chemie AG, China National Salt Industry Corporation, CIECH S.A., The Salins Group, Compass Minerals International, Inc., Archean Chemical Industries Limited, among others. |
Single User License
One User
USD 4,399
USD 3,959
tax inclusive*
Datasheet
One User
USD 2,999
USD 2,699
tax inclusive*
Five User License
Five User
USD 5,599
USD 4,759
tax inclusive*
Corporate License
Unlimited Users
USD 6,659
USD 5,660
tax inclusive*
*Please note that the prices mentioned below are starting prices for each bundle type. Kindly contact our team for further details.*
Flash Bundle
Small Business Bundle
Growth Bundle
Enterprise Bundle
*Please note that the prices mentioned below are starting prices for each bundle type. Kindly contact our team for further details.*
Flash Bundle
Number of Reports: 3
20%
tax inclusive*
Small Business Bundle
Number of Reports: 5
25%
tax inclusive*
Growth Bundle
Number of Reports: 8
30%
tax inclusive*
Enterprise Bundle
Number of Reports: 10
35%
tax inclusive*
How To Order

Select License Type
Choose the right license for your needs and access rights.

Click on ‘Buy Now’
Add the report to your cart with one click and proceed to register.

Select Mode of Payment
Choose a payment option for a secure checkout. You will be redirected accordingly.
Gain insights to stay ahead and seize opportunities.

Get insights & trends for a competitive edge.

Track prices with detailed trend reports.

Analyse trade data for supply chain insights.

Leverage cost reports for smart savings

Enhance supply chain with partnerships.

Connect For More Information
Our expert team of analysts will offer full support and resolve any queries regarding the report, before and after the purchase.
Our expert team of analysts will offer full support and resolve any queries regarding the report, before and after the purchase.
We employ meticulous research methods, blending advanced analytics and expert insights to deliver accurate, actionable industry intelligence, staying ahead of competitors.
Our skilled analysts offer unparalleled competitive advantage with detailed insights on current and emerging markets, ensuring your strategic edge.
We offer an in-depth yet simplified presentation of industry insights and analysis to meet your specific requirements effectively.


Share