

Consumer Insights
Uncover trends and behaviors shaping consumer choices today
Procurement Insights
Optimize your sourcing strategy with key market data
Industry Stats
Stay ahead with the latest trends and market analysis.

The polyacrylic acid procurement report indicates that the global consumption is highly driven by the demand in agricultural applications and is witnessing massive growth. Apart from this, the acid’s growing usage in paint and coatings, water and wastewater treatment, and the detergent industries will further drive the market. In 2023, the United States produced 1.33 billion gallons of paints and coatings valued at USD 32.8 billion.
Base Year
Historical Period
Forecast Period
The surging detergent usage in laundry services of the Asia Pacific region further broadens the scope of market application, boosting polyacrylic acid sourcing. The National Bureau of Statistics states that synthetic detergent production in China amounted to 11.064 million tons during 2023. That marked an increasing growth of 8.4% compared to the preceding year.
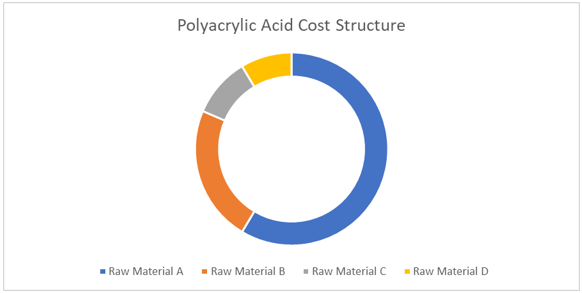
As per the polyacrylic acid procurement report, key factors driving the cost modeling of production are raw materials, energy, catalysts, operational expenses, and regulatory compliance. Raw materials form the majority of the costs involved. The chief feedstock is acrylic acid, which plays a crucial role in monomerization. Its procurement greatly determines the pricing models for making this particular chemical, especially due to its price changeability based on natural gas and crude oil market fluctuations.
As per the polyacrylic acid procurement report analysis, energy considerably influences the production cost as the monomerization process is energy-intensive in the production process. Regions with high energy prices, especially the developed regions, can incur higher production costs. Labor, plant maintenance, and overheads are some of the other operational costs which can be minimized due to automation and efficient plant management. Transportation and distribution costs also increase with distance from raw material sources and end-use markets.
Lastly, compliance with environmental regulations provides additional costs, especially in countries with strict emission controls in the polyacrylic acid procurement market. New bio-based production technologies may change the pricing dynamics by reducing dependency on fossil-based inputs and responding to sustainability concerns.
Pricing trends, as suggested by the polyacrylic aid procurement report, are bound to fluctuate depending on changes in the raw material prices. The most influential raw material cost is that of acrylic acid, which is strongly correlated with petroleum and natural gas prices. Fluctuations in global supply chains, increasing environmental regulations, and soaring demand from personal care, agricultural industries, and water treatment sectors will also affect price trends of the acid.
In general, prices are likely to go up if the demand is increased or supply is limited. The price tends to fall during a period of excess production or if the raw materials become cheaper. In addition, the polyacrylic acid procurement report indicates the growing importance of sustainability may push the bio-based alternatives of acrylic acid and influence the pricing strategies of polyacrylic acid.
The best practices for polyacrylic acid sourcing include reliable supply chains, cost optimization, and quality. Buyers can initiate long-term contracts with suppliers to reduce risks related to price volatility, especially for raw materials and energy inputs. They can also diversify sources of suppliers to reduce dependency on specific regions and ensure that there is consistent supply in the event of market disruptions.
Further, firms can select suppliers with a high record of environmental compliance so as to reflect sustainability goals. Polyacrylic acid procurement also requires efficient logistics and inventory management since the acid requires specialized transport and storage. Advanced procurement tools include market intelligence and digital platforms can help in effective forecasting and cost management in pursuit of supply chain resilience.
One of the top manufacturers of acrylic acid and its derivatives is Nippon Shokubai, which has its headquarters in Japan. With a strong research and development department, the company provides high-performance polyacrylic acids used in superabsorbent polymers, coatings, and adhesives while concentrating on ecologically responsible production techniques.
Dow is a well-known materials science firm that was founded in 1897 and has its headquarters in the United States. To achieve profitable expansion, the organization makes significant investments in research and development. In 2023, Dow, which operates in 31 countries, generated sales of over USD 45 billion.
Established in 1995, Kao Chemical Corporation serves as the Chinese manufacturing hub for the Kao Group's chemicals. The company produces polyacrylic acid family polymers, surfactants and their intermediates, and other macromolecular products.
The Lubrizol Corporation is a specialty chemical firm owned by Berkshire Hathaway that was established in 1928 and has its headquarters located in Ohio. Over 100 production plants, sales offices, and technical offices are owned and run by Lubrizol worldwide.
Established in 1988, Maxwell Additives Private Limited has its headquarters in India. The company produces 4000Mt of specialty chemicals annually at its three manufacturing facilities in and around Vadodara.
*Please note that this is only a partial list; the complete list of key players is available in the full report. Additionally, the list of key players can be customized to better suit your needs.*


Upto 15% Off
USD
$2999 $2699
$4399 $3959
$5599 $4759
$6659 $5660


*While we strive to always give you current and accurate information, the numbers depicted on the website are indicative and may differ from the actual numbers in the main report. At Expert Market Research, we aim to bring you the latest insights and trends in the market. Using our analyses and forecasts, stakeholders can understand the market dynamics, navigate challenges, and capitalize on opportunities to make data-driven strategic decisions.*
Get in touch with us for a customized solution tailored to your unique requirements and save upto 35%!
The polyacrylic acid procurement market is estimated to be valued at USD 5.20 Billion in 2025.
As per polyacrylic acid procurement report the industry is projected to grow at a CAGR of 6.52% between 2026 and 2031.
The polyacrylic acid demand is projected to grow to USD 7.60 Billion by 2031.
According to the polyacrylic acid procurement report, key drivers of the market include use in superabsorbent polymers, detergents, and cleaners.
As per the polyacrylic acid procurement report analysis, the industry is divided into co-polymer, homo-polymer, and ter-polymer.
The primary raw material used is acrylic acid.
As per the market research for procurement professionals in the industry, best practices include includes working closely with suppliers to ensure the consistent quality of polyacrylic acid for applications such as personal care and pharmaceuticals. Bulk procurement and effective inventory management are key to optimizing costs while preventing shortages.
The competitive landscape consists of Nippon Shokubai Co., Ltd., Dow Chemical Company, Kao Chemical Corporation, The Lubrizol Corporation, and Maxwell Additives Pvt. Ltd., among others.
The industry is broken down into North America, Europe, Middle East and Africa, Asia Pacific, and Latin America.
Explore our key highlights of the report and gain a concise overview of key findings, trends, and actionable insights that will empower your strategic decisions.
| REPORT FEATURES | DETAILS |
| Base Year | 2025 |
| Historical Period | 2020-2025 |
| Forecast Period | 2026-2031 |
| Growth Rate | CAGR of 6.52 from 2026 to 2031 |
| Regional Cost Structure | Key Cost Indicators, Cost Breakdown by Component |
| Raw Material Market Outlook | Raw Material Market Analysis, Mapping of Key Raw Material Suppliers, Availability of Raw Material by Region, Pricing Outlook of Key Raw Materials |
| Key Sourcing Strategies | Vendor/Supplier Selection, Price and Contract Model Structure, Sourcing Model, Negotiation Strategy |
| Supplier Analysis | Supplier Selection, Key Global Players, Key Regional Players, Supplier Profiles and SWOT Analysis, Innovation and Sustainability |
| Companies Covered | Nippon Shokubai Co., Ltd., Dow Chemical Company, Kao Chemical Corporation, The Lubrizol Corporation, and Maxwell Additives Pvt. Ltd., among others. |
Datasheet
One User
USD 2,999
USD 2,699
tax inclusive*
Single User License
One User
USD 4,399
USD 3,959
tax inclusive*
Five User License
Five User
USD 5,599
USD 4,759
tax inclusive*
Corporate License
Unlimited Users
USD 6,659
USD 5,660
tax inclusive*
*Please note that the prices mentioned below are starting prices for each bundle type. Kindly contact our team for further details.*
Flash Bundle
Small Business Bundle
Growth Bundle
Enterprise Bundle
*Please note that the prices mentioned below are starting prices for each bundle type. Kindly contact our team for further details.*
Flash Bundle
Number of Reports: 3
20%
tax inclusive*
Small Business Bundle
Number of Reports: 5
25%
tax inclusive*
Growth Bundle
Number of Reports: 8
30%
tax inclusive*
Enterprise Bundle
Number of Reports: 10
35%
tax inclusive*
How To Order

Select License Type
Choose the right license for your needs and access rights.

Click on ‘Buy Now’
Add the report to your cart with one click and proceed to register.

Select Mode of Payment
Choose a payment option for a secure checkout. You will be redirected accordingly.
Gain insights to stay ahead and seize opportunities.

Get insights & trends for a competitive edge.

Track prices with detailed trend reports.

Analyse trade data for supply chain insights.

Leverage cost reports for smart savings

Enhance supply chain with partnerships.

Connect For More Information
Our expert team of analysts will offer full support and resolve any queries regarding the report, before and after the purchase.
Our expert team of analysts will offer full support and resolve any queries regarding the report, before and after the purchase.
We employ meticulous research methods, blending advanced analytics and expert insights to deliver accurate, actionable industry intelligence, staying ahead of competitors.
Our skilled analysts offer unparalleled competitive advantage with detailed insights on current and emerging markets, ensuring your strategic edge.
We offer an in-depth yet simplified presentation of industry insights and analysis to meet your specific requirements effectively.


Share