

Consumer Insights
Uncover trends and behaviors shaping consumer choices today
Procurement Insights
Optimize your sourcing strategy with key market data
Industry Stats
Stay ahead with the latest trends and market analysis.

In the past couple of years, the consumption of pea starch across the globe has witnessed tremendous growth. The global demand for plant-based and gluten-free products is increasing at an unprecedented rate, and pea starch, obtained from yellow peas, is one versatile, sustainable ingredient used in industries such as food, beverages, pharmaceuticals, and cosmetics. It is applied as a thickening agent, stabilizer, and emulsifier with some benefits like being non-GMO, allergen-free, and highly digestible compared to other starches. The pea starch procurement report highlights these growing trends and their impact on global markets.
Base Year
Historical Period
Forecast Period
Key drivers for the demand for pea starch include increased production in plant-based and gluten-free products, mainly from the food and beverage industry. Europe is also leading in both production and consumption. Major countries for the producers are France, Germany, and Russia, all with significant volumes of pea crops. North America, particularly Canada, is a key contributor driven by large-scale pea farming as well as rising demand for plant-based ingredients. As per the pea starch procurement report, additionally, the growing emphasis on sustainable and eco-friendly ingredients, such as pea starch, is addressing environmental concerns and supporting its use in various applications across food, beverage, and pharmaceutical sectors. Services related to processing and quality assurance are crucial for maintaining the high standards expected by manufacturers.
On the supply side, advancements in production technologies and increased pea cultivation, particularly in Europe and North America, enhance the supply of pea starch. Expansions in processing capacities and the adoption of efficient extraction methods have been reducing production costs while increasing supply. Fluctuations in raw material availability on account of the vagaries of weather conditions for pea crops, higher energy prices, among other factors, pose a threat to the stability of supply. The pea starch procurement report indicates that sourcing high-quality raw materials remains a key challenge.
The cost structure for the production of pea starch involves several key factors, such as raw materials, energy, processing, labor, and transportation. The pea starch procurement report states that among these factors, raw materials, especially yellow peas, represent the largest component of the costs. The cost of peas depends on agricultural conditions, crop yields, and fluctuations in the market. Energy also forms a considerable cost factor as the extraction and drying processes consume a lot of energy, mainly in regions where electricity is relatively expensive. Effective procurement strategies help mitigate these costs.
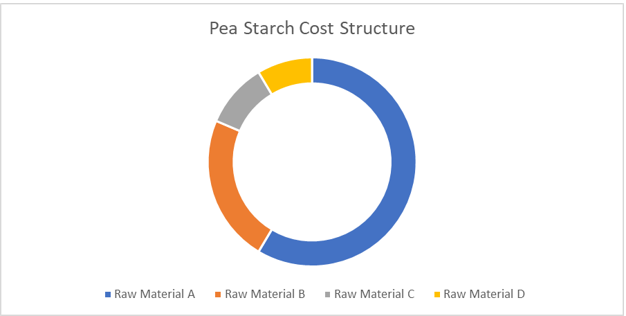
The other major cost element is the processing expenses that include cleaning, milling, and starch extraction. These costs arise due to sophisticated machinery and labor-intensive processes. Labor costs in the form of wages for factory workers and operational staff also form part of the overall expenses. Category management helps streamline these operational costs by optimizing supplier relationships and material handling. The pea starch procurement report highlights how cost-efficient sourcing methods can significantly impact the final product price.
Transportation and distribution costs are influenced by the proximity to raw material sources and markets. Since pea starch is often shipped in bulk, transportation costs can vary depending on location. Additionally, compliance with food safety and environmental regulations introduces another layer of costs, especially in regions with strict standards. The pea starch procurement report outlines cost control measures and regulatory compliance strategies.
Pea starch prices are influenced by several key factors, including raw material costs, energy prices, and supply-demand imbalances. The price of yellow peas, the primary feedstock, is impacted by agricultural yields, weather conditions, and market demand. Additionally, energy costs associated with production processes, such as drying and extraction, directly affect pricing. Pricing models for pea starch vary depending on supply chain stability and long-term contracts. The pea starch procurement report notes that competitive sourcing strategies can help businesses navigate price fluctuations.
Rising demand for plant-based and gluten-free products has further contributed to increased pea starch prices. Supply chain disruptions and transportation costs also play a significant role. However, increasing production capacity and technological innovations in processing may help stabilize prices over time by balancing the market's demand and supply. Effective procurement research helps businesses understand pricing trends and market dynamics. The pea starch procurement report highlights how pricing strategies can help businesses mitigate cost volatility.
Pea starch procurement practice involves sourcing high-quality yellow peas from reliable suppliers, with a focus on ensuring consistent supply and price stability. The pea starch procurement report emphasizes the importance of category management in building strong supplier relationships. Long-term contracts are usually entered into between buyers and farmers or suppliers to ensure a consistent supply of peas from harvest to harvest, based on yield, among other factors that influence pricing regionally. The pea starch procurement report provides insights into Negotiation strategies that help secure favorable terms for buyers.
Moreover, sustainability practices are followed while procuring; many companies use non-GMO and organic peas due to growing consumer demand for clean-label products. In addition, suppliers have to comply with standards and quality certification. Cost modeling is an essential tool in assessing the financial viability of pea starch procurement. The pea starch procurement report also covers procurement best practices that optimize sourcing efficiency and supplier performance.
Logistics play a critical role in procurement, with transportation costs influencing the final price of pea starch, especially in global markets. Strategic purchasing decisions help minimize transportation expenses and improve supply chain resilience. The pea starch procurement report details best approaches for managing logistics challenges. Companies use market research for procurement professionals to forecast pricing, analyze demand trends, and improve purchasing decisions. The pea starch procurement report further emphasizes the significance of pricing trends in aligning procurement strategies with market conditions.
Headquartered in Chicago, Illinois, Ingredion was founded in 1906. The company specializes in producing ingredients for the food, beverage, pharmaceutical, and industrial sectors.
Founded in 1933 and headquartered in Lestrem, France, Roquette Frères is a global leader in plant-based ingredients, serving sectors like food, nutrition, and pharmaceuticals.
As per the pea starch procurement report, headquartered in Yantai, China, Yantai Shuangta Food was founded in 1992. It specializes in producing pea protein and other plant-based food ingredients.
Founded in 1985 and headquartered in Minneapolis, Minnesota, PURIS® is a leading supplier of pea protein and plant-based ingredients for the food and beverage industry.
Founded in 1928 and headquartered in Emlichheim, Germany, Emsland Group produces starch-based products and ingredients for the food, feed, and technical industries.
*Please note that this is only a partial list; the complete list of key players is available in the full report. Additionally, the list of key players can be customized to better suit your needs.*


Upto 15% Off
USD
$2999 $2699
$4399 $3959
$5599 $4759
$6659 $5660


*While we strive to always give you current and accurate information, the numbers depicted on the website are indicative and may differ from the actual numbers in the main report. At Expert Market Research, we aim to bring you the latest insights and trends in the market. Using our analyses and forecasts, stakeholders can understand the market dynamics, navigate challenges, and capitalize on opportunities to make data-driven strategic decisions.*
Get in touch with us for a customized solution tailored to your unique requirements and save upto 35%!
The pea starch market is estimated to be valued at USD 473.60 Million.
The industry is projected to grow at a CAGR of 8.40% between 2026 and 2031.
The pea starch demand is projected to grow to USD 768.40 Million by 2031.
The pea starch production is concentrated in Canada, Europe, and the United States.
The global pea starch consumption is experiencing significant growth, driven by its widespread use as a natural thickening agent in food products and the growing demand for sustainable, plant-based alternatives in the food and cosmetic industries.
By type, the market is divided into organic/GMO and conventional.
The best procurement practices in the pea starch industry focus on sustainability, quality, and efficiency. Companies prioritize sourcing from suppliers who adopt sustainable and organic farming practices, often implementing ethical sourcing strategies to meet evolving consumer demands. Establishing strong relationships with reliable suppliers, including farmers and specialized vendors, is crucial for ensuring consistent quality and supply.
The competitive landscape consists of Ingredion Incorporated, PURIS, Roquette Frères, Yantai Shuangta Food Co., Ltd, Axiom Foods, and Emsland Group among others.
The market is broken down into North America, Europe, Middle East and Africa, Asia Pacific, and Latin America.
Explore our key highlights of the report and gain a concise overview of key findings, trends, and actionable insights that will empower your strategic decisions.
| REPORT FEATURES | DETAILS |
| Base Year | 2025 |
| Historical Period | 2020-2025 |
| Forecast Period | 2026-2031 |
| Growth Rate | CAGR of 8.40 from 2026 to 2031 |
| Regional Cost Structure | Key Cost Indicators, Cost Breakdown by Component |
| Raw Material Market Outlook | Raw Material Market Analysis, Mapping of Key Raw Material Suppliers, Availability of Raw Material by Region, Pricing Outlook of Key Raw Materials |
| Key Sourcing Strategies | Vendor/Supplier Selection, Price and Contract Model Structure, Sourcing Model, Negotiation Strategy |
| Supplier Analysis | Supplier Selection, Key Global Players, Key Regional Players, Supplier Profiles and SWOT Analysis, Innovation and Sustainability |
| Companies Covered | Ingredion Incorporated, PURIS, Roquette Frères, Yantai Shuangta Food Co., Ltd, Axiom Foods, and Emsland Group among others. |
Datasheet
One User
USD 2,999
USD 2,699
tax inclusive*
Single User License
One User
USD 4,399
USD 3,959
tax inclusive*
Five User License
Five User
USD 5,599
USD 4,759
tax inclusive*
Corporate License
Unlimited Users
USD 6,659
USD 5,660
tax inclusive*
*Please note that the prices mentioned below are starting prices for each bundle type. Kindly contact our team for further details.*
Flash Bundle
Small Business Bundle
Growth Bundle
Enterprise Bundle
*Please note that the prices mentioned below are starting prices for each bundle type. Kindly contact our team for further details.*
Flash Bundle
Number of Reports: 3
20%
tax inclusive*
Small Business Bundle
Number of Reports: 5
25%
tax inclusive*
Growth Bundle
Number of Reports: 8
30%
tax inclusive*
Enterprise Bundle
Number of Reports: 10
35%
tax inclusive*
How To Order

Select License Type
Choose the right license for your needs and access rights.

Click on ‘Buy Now’
Add the report to your cart with one click and proceed to register.

Select Mode of Payment
Choose a payment option for a secure checkout. You will be redirected accordingly.
Gain insights to stay ahead and seize opportunities.

Get insights & trends for a competitive edge.

Track prices with detailed trend reports.

Analyse trade data for supply chain insights.

Leverage cost reports for smart savings

Enhance supply chain with partnerships.

Connect For More Information
Our expert team of analysts will offer full support and resolve any queries regarding the report, before and after the purchase.
Our expert team of analysts will offer full support and resolve any queries regarding the report, before and after the purchase.
We employ meticulous research methods, blending advanced analytics and expert insights to deliver accurate, actionable industry intelligence, staying ahead of competitors.
Our skilled analysts offer unparalleled competitive advantage with detailed insights on current and emerging markets, ensuring your strategic edge.
We offer an in-depth yet simplified presentation of industry insights and analysis to meet your specific requirements effectively.


Share