

Consumer Insights
Uncover trends and behaviors shaping consumer choices today
Procurement Insights
Optimize your sourcing strategy with key market data
Industry Stats
Stay ahead with the latest trends and market analysis.

The neoprene procurement report indicates that global consumption of neoprene is currently experiencing high growth with wide applications of neoprene in automobile and medical manufacturing. Neoprene is a synthetic rubber manufactured through the polymerization of chloroprene.
Base Year
Historical Period
Forecast Period
Neoprene's exceptional weather resistance makes it a popular material for power transmission belts, tires, hose covers, and steering and braking system components. As per the neoprene procurement report, approximately USD 13.5 trillion was made annually by the worldwide manufacturing sector in 2024. The United States' manufacturing sector accounted for 11.4% of the nation's overall GDP in 2022, contributing USD 2.3 trillion.
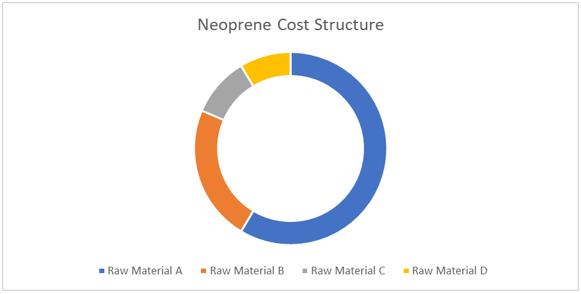
According to the neoprene procurement report, key factors driving the cost modeling of production include raw materials, energy, catalysts, costs of operations, and regulatory requirements. Chloroprene is among the primary feedstocks in polymerizing neoprene. Price fluctuations of such feedstocks due to natural gases and crude oil impact the entire pricing models. Energy expenditures are a main factor in setting production costs as the process also includes energy-based steps such as polymerization, which is among the most demanding in terms of energy. An area with significant energy prices sees higher production.
Furthermore, pricing strategies also depend on transportation and distribution costs. These are directly affected by location in relation to raw material supply and end-use markets, since neoprene is often transported on pallets. As per the neoprene procurement market report, environmental compliance costs also impact neoprene costs, mainly in regions that have strict controls over emissions. Bio-based emerging production methods can alter the dynamics of cost factors globally, determining competitive pricing of neoprene.
Neoprene prices depend on the fluctuation of raw material costs, energy, and supply-demand dynamics. According to the neoprene procurement report, the key feedstock is chloroprene, whose price fluctuation is influenced by crude oil and natural gas markets. Production costs, including energy, labor, and transportation, also impact strategic pricing in the market. Other than that, supply-demand dynamics are the most critical factor, as demand from industries such as automotive, construction, and consumer goods increases procurement market prices. Geopolitical issues and trade policies affecting raw material availability cause price volatility. Further, advancements in sustainable production and development of eco-friendly alternatives can also impact the market. Regional economic conditions and currency exchange rates contribute to neoprene price variations.
Best practices considered in the neoprene procurement market include acquiring the most reliable supply chains that ensure low cost and high quality. Buyers can also partner with selected suppliers for long-term contracts to minimize volatility in price including raw materials and energy inputs. As part of their negotiation strategies, transparency in prices and logistics, coupled with lead times and support in managing the buyer's inventory, compliance with environmental and safety standards, and other key aspects should be considered as per the neoprene procurement report. Technical specifications such as tensile strength and resistance to heat, chemicals, and weathering should be in accordance with the requirements of the application. Strong communication and service agreements can ensure flexibility for custom formulations or sudden demand changes. Focus on a long-term partnership can guarantee supply stability and optimize procurement strategies.
One of the top producers of neoprene, Denka Corporation was established in 1915 and has its headquarters in Tokyo, Japan. The business sells neoprene liquid dispersions for use in coatings, binders, adhesives, and other applications.
The well-known producer of neoprene (chloroprene rubber, or CR) and neoprene products is SEDO Chemicals Neoprene GmbH, which was established in 1984 and has its headquarters in Berlin, Germany. Blending synthetic CR rubber with blowing chemicals, which produce a foaming effect, is how this company makes neoprene.
With its headquarters located in India, Deesawala Rubber Industries is the country's top producer of rubber gaskets that are authorized by WRAS, BSEN 681, and IS 5382. Its plant has state-of-the-art manufacturing capabilities for extruded components, calendaring, and mixing. A range of custom-molded rubber components are among its offerings.
Headquartered in Mumbai, India, Zenith is a leading manufacturer and exporter of high-quality industrial rubber sheeting products The company is a prominent manufacturer of neoprene products, specializing in rubber sheets, gaskets, and seals for diverse industrial sectors. The company produces about 90 tons of rubber compound per day.
*Please note that this is only a partial list; the complete list of key players is available in the full report. Additionally, the list of key players can be customized to better suit your needs.*


Upto 30% Off
USD


*While we strive to always give you current and accurate information, the numbers depicted on the website are indicative and may differ from the actual numbers in the main report. At Expert Market Research, we aim to bring you the latest insights and trends in the market. Using our analyses and forecasts, stakeholders can understand the market dynamics, navigate challenges, and capitalize on opportunities to make data-driven strategic decisions.*
Get in touch with us for a customized solution tailored to your unique requirements and save upto 35%!
The neoprene procurement market is estimated to be valued at 477.01 Kilo Tons in 2025.
As per neoprene procurement report the industry is projected to grow at a CAGR of 4.50% between 2026 and 2031.
The neoprene demand is projected to grow to 621.19 Kilo Tons by 2031.
According to the neoprene procurement report, key drivers of the market include widespread applications in automotive and medical manufacturing.
As per the neoprene procurement report analysis, the industry is divided into butadiene route and acetylene route.
The primary raw material used is chloroprene.
As per the market research for procurement professionals in the industry, best practices include working with suppliers who offer consistent product quality and can adapt to customer needs. Emphasis is placed on sustainability and regulatory compliance, with long-term relationships ensuring reliability.
The competitive landscape consists of Denka Corporation Limited, Zenith Rubber, SEDO Chemicals Neoprene GmbH, and Deesawala Rubber Industries, among others.
The industry is broken down into North America, Europe, Middle East and Africa, Asia Pacific, and Latin America.
Explore our key highlights of the report and gain a concise overview of key findings, trends, and actionable insights that will empower your strategic decisions.
| REPORT FEATURES | DETAILS |
| Base Year | 2025 |
| Historical Period | 2020-2025 |
| Forecast Period | 2026-2031 |
| Growth Rate | CAGR of 4.50 from 2026 to 2031 |
| Regional Cost Structure | Key Cost Indicators, Cost Breakdown by Component |
| Raw Material Market Outlook | Raw Material Market Analysis, Mapping of Key Raw Material Suppliers, Availability of Raw Material by Region, Pricing Outlook of Key Raw Materials |
| Key Sourcing Strategies | Vendor/Supplier Selection, Price and Contract Model Structure, Sourcing Model, Negotiation Strategy |
| Supplier Analysis | Supplier Selection, Key Global Players, Key Regional Players, Supplier Profiles and SWOT Analysis, Innovation and Sustainability |
| Companies Covered | Denka Corporation Limited, Zenith Rubber, SEDO Chemicals Neoprene GmbH, and Deesawala Rubber Industries, among others. |
Single User License
One User
USD 4,399
USD 3,959
tax inclusive*
Datasheet
One User
USD 2,999
USD 2,699
tax inclusive*
Five User License
Five User
USD 5,599
USD 4,759
tax inclusive*
Corporate License
Unlimited Users
USD 6,659
USD 5,660
tax inclusive*
*Please note that the prices mentioned below are starting prices for each bundle type. Kindly contact our team for further details.*
Flash Bundle
Small Business Bundle
Growth Bundle
Enterprise Bundle
*Please note that the prices mentioned below are starting prices for each bundle type. Kindly contact our team for further details.*
Flash Bundle
Number of Reports: 3
20%
tax inclusive*
Small Business Bundle
Number of Reports: 5
25%
tax inclusive*
Growth Bundle
Number of Reports: 8
30%
tax inclusive*
Enterprise Bundle
Number of Reports: 10
35%
tax inclusive*
How To Order

Select License Type
Choose the right license for your needs and access rights.

Click on ‘Buy Now’
Add the report to your cart with one click and proceed to register.

Select Mode of Payment
Choose a payment option for a secure checkout. You will be redirected accordingly.
Gain insights to stay ahead and seize opportunities.

Get insights & trends for a competitive edge.

Track prices with detailed trend reports.

Analyse trade data for supply chain insights.

Leverage cost reports for smart savings

Enhance supply chain with partnerships.

Connect For More Information
Our expert team of analysts will offer full support and resolve any queries regarding the report, before and after the purchase.
Our expert team of analysts will offer full support and resolve any queries regarding the report, before and after the purchase.
We employ meticulous research methods, blending advanced analytics and expert insights to deliver accurate, actionable industry intelligence, staying ahead of competitors.
Our skilled analysts offer unparalleled competitive advantage with detailed insights on current and emerging markets, ensuring your strategic edge.
We offer an in-depth yet simplified presentation of industry insights and analysis to meet your specific requirements effectively.


Share