

Consumer Insights
Uncover trends and behaviors shaping consumer choices today
Procurement Insights
Optimize your sourcing strategy with key market data
Industry Stats
Stay ahead with the latest trends and market analysis.

The global activated carbon consumption is experiencing steady growth, supported by its extensive use across industries such as water treatment, air purification, pharmaceuticals, and food and beverage processing. Activated carbon is known for its high porosity and adsorption capacity, and is widely employed for removing impurities, odors, and contaminants.
Base Year
Historical Period
Forecast Period
Key drivers of activated carbon procurement report include the increasing focus on environmental regulations, the growing need for clean water and air solutions, and the rising adoption of activated carbon in medical applications such as drug delivery systems and detoxification treatments. Asia-Pacific is the largest consumer of activated carbon, fueled by expanding industrial activities, urbanization, and water treatment initiatives in countries like China and India. Europe, the United States, and Japan are recognized as the leading producers of high-quality activated carbon, with their advanced manufacturing capabilities and stringent quality standards contributing to their dominance in the global supply.
On the supply side, advancements in production technologies, including the use of renewable raw materials like coconut shells, are boosting output to meet escalating demand. Nevertheless, challenges such as high production costs, fluctuations in raw material availability, and increasing competition from alternative filtration technologies may influence the growth of activated carbon procurement market.
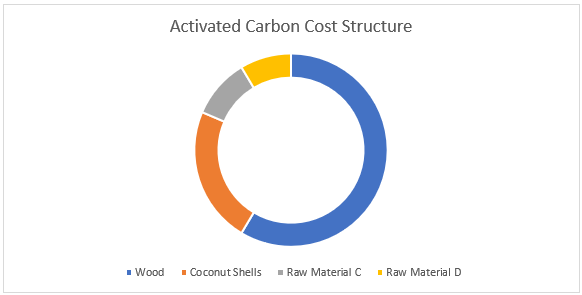
The cost modeling of activated carbon production is shaped by factors such as raw materials, energy, operational expenses, transportation, and compliance with environmental regulations. The primary cost component is raw materials, with inputs such as coal, coconut shells, or wood playing a crucial role. The choice of raw material depends on the desired quality and application of the activated carbon. Fluctuations in the availability and pricing strategies of these feedstocks, often influenced by agricultural and mining outputs, directly affect production costs.
Energy expenses are a significant factor in activated carbon procurement report, as the activation process, whether thermal or chemical, requires high temperatures and precise control. This is particularly true for steam activation, which consumes substantial energy for the heating and activation stages. Facilities in regions with affordable and reliable energy sources gain a competitive edge in cost efficiency.
Operational expenses, including labor, maintenance, and facility overhead, also contribute to the overall cost. Automated systems and efficient plant management can help optimize production processes and reduce costs. Transportation and logistics costs vary based on the proximity of raw material sourcing and end markets, with bulk shipments being a common mode for large-scale distribution.
Compliance with environmental regulations, especially those concerning emissions and waste management, impacts production costs of activated carbon procurement report. The safe disposal or reuse of by-products, such as tar or spent chemicals from activation processes, adds to operational expenses.
Emerging innovations, such as the use of renewable raw materials or advancements in activation technologies, may alter the cost structure by enhancing yields, reducing energy consumption, and minimizing environmental impact. These interconnected factors define the pricing models and competitiveness of activated carbon in global markets.
According to the activated carbon procurement report, activated carbon prices are shaped by factors such as raw material costs, energy expenses, and market demand. Fluctuations in the availability and pricing of feedstocks like coal, coconut shells, or wood significantly impact costs, along with energy-intensive activation processes. Increasing demand across industries, coupled with stricter environmental regulations, has driven prices upward. Transportation and logistics expenses also contribute to pricing trends, especially for bulk shipments. Advancements in production technologies and improved efficiency in raw material utilization are expected to help stabilize pricing strategies over time.
Procurement best practices in the activated carbon industry prioritize securing reliable suppliers, managing costs, and ensuring product quality. Long-term contracts with feedstock providers, such as those supplying coal, coconut shells, or wood, are commonly employed to reduce exposure to price fluctuations and supply disruptions. Diversifying supplier networks helps mitigate risks associated with raw material shortages or delays in the activated carbon procurement report. Sustainability considerations are increasingly shaping procurement decisions, with a preference for suppliers adhering to environmental and regulatory standards. Effective logistics and inventory management along with category management are essential, given the bulk nature and specific storage requirements of activated carbon. Advanced procurement tools and equipment, including digital platforms for demand forecasting and market analysis, are widely used to optimize costs and enhance supply chain efficiency.
The company was founded in 1926 and is headquartered in Tokyo, Japan, a global leader in specialty chemicals and materials. The company is a prominent producer of activated carbon, offering high-performance solutions for air and water purification, supported by advanced manufacturing technologies.
Established in 1983 and headquartered in West Palm Beach, Florida, Oxbow Corporation is a major player in the production and distribution of activated carbon. As per the activated carbon procurement report, the company specializes in high-quality coal-based activated carbon and serves a wide range of industrial and environmental markets.
It was founded in 1878 and is headquartered in Colombo, Sri Lanka. Hayleys PLC is a diversified multinational conglomerate with a strong presence in activated carbon production. The company is known for its coconut-shell-based activated carbon and caters to global markets with a focus on sustainability and innovation.
It was established in 1995 and headquartered in Kochi, India. IGCL is a leading manufacturer of coconut-shell-based activated carbon. According to the activated carbon procurement report, the company is recognized for its high-quality products and commitment to environmental compliance, serving industries like water treatment and air purification.
Founded in 1985 and headquartered in Gyeongsangnam, South Korea, Shinkwang Chemical Industry Co., Ltd. is a key player in the activated carbon market. The company offers a wide range of activated carbon solutions, leveraging advanced production techniques to meet diverse industry needs.
*Please note that this is only a partial list; the complete list of key players is available in the full report. Additionally, the list of key players can be customized to better suit your needs.*


Upto 15% Off
USD
$2999 $2699
$4399 $3959
$5599 $4759
$6659 $5660


*While we strive to always give you current and accurate information, the numbers depicted on the website are indicative and may differ from the actual numbers in the main report. At Expert Market Research, we aim to bring you the latest insights and trends in the market. Using our analyses and forecasts, stakeholders can understand the market dynamics, navigate challenges, and capitalize on opportunities to make data-driven strategic decisions.*
Get in touch with us for a customized solution tailored to your unique requirements and save upto 35%!
The global activated carbon market size stood at a value of USD 5.69 Billion in 2025.
The industry is projected to grow at a CAGR of 9.60% between 2026 and 2031.
The activated carbon procurement report is projected to grow to USD 9.86 Billion by 2031.
Activated carbon production is concentrated in Europe and the United States.
The global activated carbon procurement market report is expanding due to its critical applications in water treatment, air purification, and industrial processes. The growing focus on environmental regulations and the demand for effective filtration and purification solutions are key drivers of this growth.
By type, the market is divided into powdered activated carbon, granular activated carbon and others.
The primary raw materials used in the production of activated carbon are coal, coconut shells, and wood. These feedstocks undergo thermal or chemical activation processes to achieve high porosity and adsorption capacity.
Activated carbon procurement focuses on sourcing from suppliers with high-adsorption capacity, ensuring consistent quality of carbon grades (e.g., powdered, granular), and optimizing supply chains for industries like water treatment and air purification.
The competitive landscape of the activated carbon industry consists of Kuraray Co., Ltd., Oxbow Corporation, Hayleys PLC, Indo German Carbon Limited (IGCL), Shinkwang Chemical Industry Co., Ltd., S.I.C.A.V. Spa, Century Chemical Works Sdn. Bhd., Cabot Corporation, Osaka Gas Chemicals Co., Ltd., Donau Carbon GmbH, Carbon Activated Corporation, Ingevity Corporation, Silcarbon Aktivkohle GmbH, CPL/Puragen Activated Carbons, Euroquarz GmbH, and Active Carbon India Pvt. Ltd., among others.
The market is broken down into North America, Latin America, EMEA, and APAC.
Explore our key highlights of the report and gain a concise overview of key findings, trends, and actionable insights that will empower your strategic decisions.
| REPORT FEATURES | DETAILS |
| Base Year | 2025 |
| Historical Period | 2020-2025 |
| Forecast Period | 2026-2031 |
| Growth Rate | CAGR of 9.60 from 2026 to 2031 |
| Regional Cost Structure | Key Cost Indicators, Cost Breakdown by Component |
| Raw Material Market Outlook | Raw Material Market Analysis, Mapping of Key Raw Material Suppliers, Availability of Raw Material by Region, Pricing Outlook of Key Raw Materials |
| Key Sourcing Strategies | Vendor/Supplier Selection, Price and Contract Model Structure, Sourcing Model, Negotiation Strategy |
| Supplier Analysis | Supplier Selection, Key Global Players, Key Regional Players, Supplier Profiles and SWOT Analysis, Innovation and Sustainability |
| Companies Covered | Kuraray Co., Ltd., Oxbow Corporation, Hayleys PLC, Indo German Carbon Limited (IGCL), Shinkwang Chemical Industry Co., Ltd., S.I.C.A.V. Spa, Century Chemical Works Sdn. Bhd., Cabot Corporation, Osaka Gas Chemicals Co., Ltd., Donau Carbon GmbH, Carbon Activated Corporation, Ingevity Corporation, Silcarbon Aktivkohle GmbH, CPL/Puragen Activated Carbons, Euroquarz GmbH, and Active Carbon India Pvt. Ltd., among others. |
Datasheet
One User
USD 2,999
USD 2,699
tax inclusive*
Single User License
One User
USD 4,399
USD 3,959
tax inclusive*
Five User License
Five User
USD 5,599
USD 4,759
tax inclusive*
Corporate License
Unlimited Users
USD 6,659
USD 5,660
tax inclusive*
*Please note that the prices mentioned below are starting prices for each bundle type. Kindly contact our team for further details.*
Flash Bundle
Small Business Bundle
Growth Bundle
Enterprise Bundle
*Please note that the prices mentioned below are starting prices for each bundle type. Kindly contact our team for further details.*
Flash Bundle
Number of Reports: 3
20%
tax inclusive*
Small Business Bundle
Number of Reports: 5
25%
tax inclusive*
Growth Bundle
Number of Reports: 8
30%
tax inclusive*
Enterprise Bundle
Number of Reports: 10
35%
tax inclusive*
How To Order

Select License Type
Choose the right license for your needs and access rights.

Click on ‘Buy Now’
Add the report to your cart with one click and proceed to register.

Select Mode of Payment
Choose a payment option for a secure checkout. You will be redirected accordingly.
Gain insights to stay ahead and seize opportunities.

Get insights & trends for a competitive edge.

Track prices with detailed trend reports.

Analyse trade data for supply chain insights.

Leverage cost reports for smart savings

Enhance supply chain with partnerships.

Connect For More Information
Our expert team of analysts will offer full support and resolve any queries regarding the report, before and after the purchase.
Our expert team of analysts will offer full support and resolve any queries regarding the report, before and after the purchase.
We employ meticulous research methods, blending advanced analytics and expert insights to deliver accurate, actionable industry intelligence, staying ahead of competitors.
Our skilled analysts offer unparalleled competitive advantage with detailed insights on current and emerging markets, ensuring your strategic edge.
We offer an in-depth yet simplified presentation of industry insights and analysis to meet your specific requirements effectively.


Share