Add 2 More Reports For 20% off

Report Overview

The global virus filtration market was valued at USD 4.81 Billion in 2024. It is expected to grow at a CAGR of 11.60% during the forecast period of 2025-2034 and attain a market value of USD 14.41 Billion by 2034. The market growth is driven by the rising incidence of viral contamination in biomanufacturing and the growing focus on quality and safety in healthcare. Patents are focused on advanced technologies such as membrane-based filters, chromatography, nanofiltration, and depth filtration.

  • The increasing need for biopharmaceuticals, including vaccines and monoclonal antibodies, is driving the requirement for efficient virus filtration.
  • Global regulatory agencies are implementing more stringent regulations regarding the purity of biologics. As a result, more sophisticated virus filtration technologies are being used to abide by these rules and guarantee product safety. This is impacting the patent landscape significantly.
  • Viral contamination risks have come to light because of high-profile contamination cases in the biologics manufacturing industry. As a result, there is more emphasis on effective virus filtration methods to stop contamination and guarantee product integrity.

Compound Annual Growth Rate

Value in USD Billion

11.6%

2025-2034


Virus Filtration Patent Landscape Outlook

*this image is indicative*

Patent Landscape Report Coverage

The Global Virus Filtration Patent Landscape Report provides a comprehensive and in-depth analysis of the patents in this growing industry. The key sections captured in the report for virus filtration include a thorough examination of the patent portfolios of key players, covering aspects such as the number of patents and types of technologies patented. It includes the latest trends, geographical distribution of patents, top IP player profiles, technological segmentation, and patent valuation associated with virus filtration. The breakdown of patents by technical segments is provided, giving more clarity on the specific areas of innovation within virus filtration technologies.

Key Inclusions:

Patent Valuation Analysis

An evaluation and competitive benchmarking of key members of unique patent families are covered in the analysis for virus filtration technologies. The important parameters have been taken into consideration including IP document, year of application, number of citations, time to expiry, and jurisdiction associated with virus filtration.

Analysis of Patent Applications

A comprehensive summary of several patent applications which were filed across different jurisdictions for virus filtration and their relative value are covered. The analysis will cover the capital in terms of innovation and innovation type.

Analysis of Granted Patents

Detailed analysis of the granted patents across different jurisdictions for virus filtration and their relative value in the IP are covered in the final report.

What is Virus Filtration?

Virus filtration is a purification technique used to eliminate viral impurities from biological products like therapeutic proteins and vaccines. It makes use of specific filters whose pores are small enough to trap viruses while still letting the right molecules pass through. This procedure guards against viral contamination, ensuring the efficacy and safety of biologics.

The components of virus filtration include filtration systems, kits, reagents, and services. Systems for filtering liquids or gases are used to get rid of undesirable particles, impurities, or microorganisms. To ensure the safety and purity of biological products, virus filtration precisely targets and eliminates viruses from said products.

Virus Filtration Industry Growth Drivers

Technological Advancements in Filtration Techniques is Expected to Boost the Patent Industry Growth

Technological developments in filtration methods improve the precision and efficiency of virus elimination procedures, resulting in safer biopharmaceutical products. Advancements like enhanced membrane materials and nanofiltration techniques lower production costs while boosting virus capture efficiency. For instance, the Ultipor VF Grade DV20 Filter, a novel nanofiber-based filtration product from Pall Corporation improves virus capture while preserving high flow rates. This technological development satisfies manufacturers' demands for more dependable and reasonably priced virus filtration solutions by reflecting the market's emphasis on maximizing filtration performance.

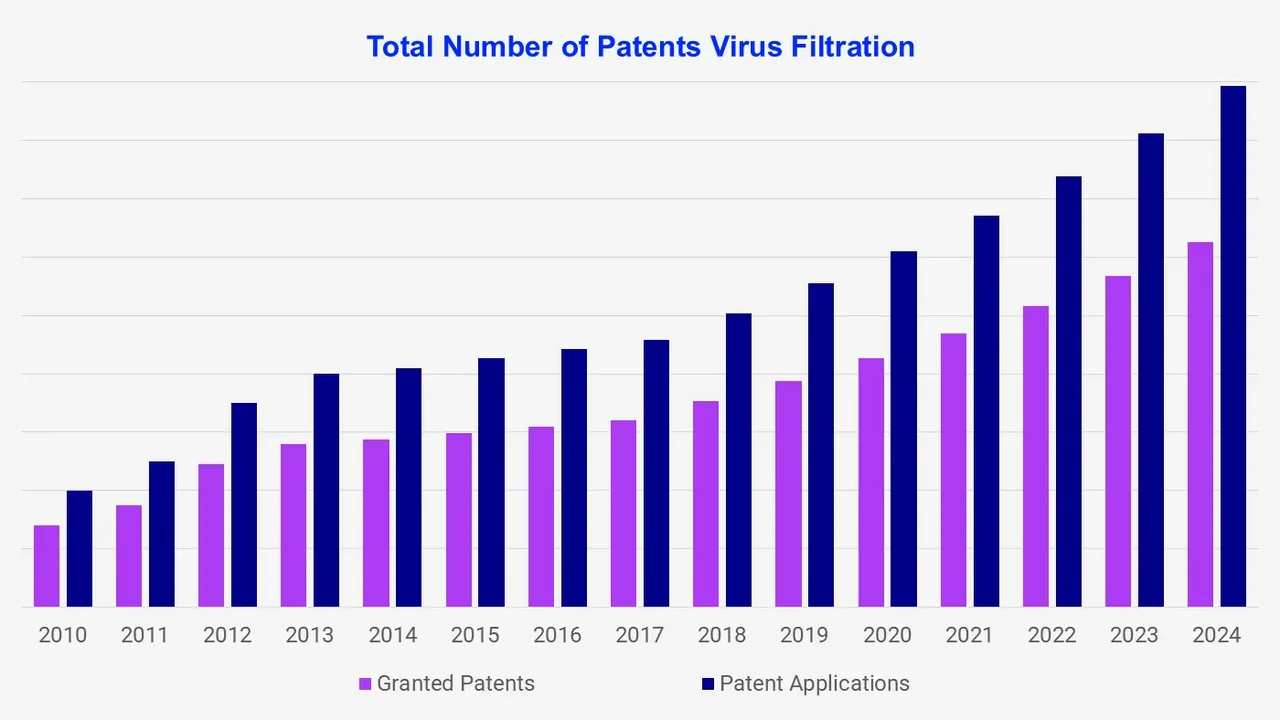
There is an increase in patent activity which focuses on enhancing the performance of virus filtration. There were 12,650 patents granted in 2022. Patents covering these technologies are crucial for companies and thus impact the virus filtration patent landscape.

Increasing Demand for Biopharmaceuticals is Expected to Propel Virus Filtration Patent Industry

Strict virus filtration is required to guarantee product safety and efficacy due to the growing demand for biopharmaceuticals, which include therapeutic proteins and vaccines. In order to comply with regulations and avoid contamination, the market for efficient virus filtration solutions is growing along with the production of biologics.

Virus Filtration Industry Patent Segmentation

The report will cover the following sections in detail:

Analysis by Product

  • Filtration Systems
  • Kits & Reagents
  • Services

Analysis by Application

  • Medical Devices
  • Water Purification
  • Air Purification
  • Biological
  • Vaccines and Therapeutics
  • Blood and Blood Products
  • Cellular and Gene Therapy Products
  • Tissue and Tissue Products
  • Others

Virus Filtration Patent Segmentation Analysis

The breakup based on product includes filtration systems, kits, reagents and services. Viral filtration is an essential step in biological processes that removes viral particles from goods like therapeutic proteins and vaccines. Ensuring that these biologics are devoid of viral contamination preserves their efficacy and safety for use in medicine. Specialized membranes are used in the filtration process to capture viruses while permitting beneficial biological molecules to flow through.

Virus Filtration Patent Jurisdiction Analysis

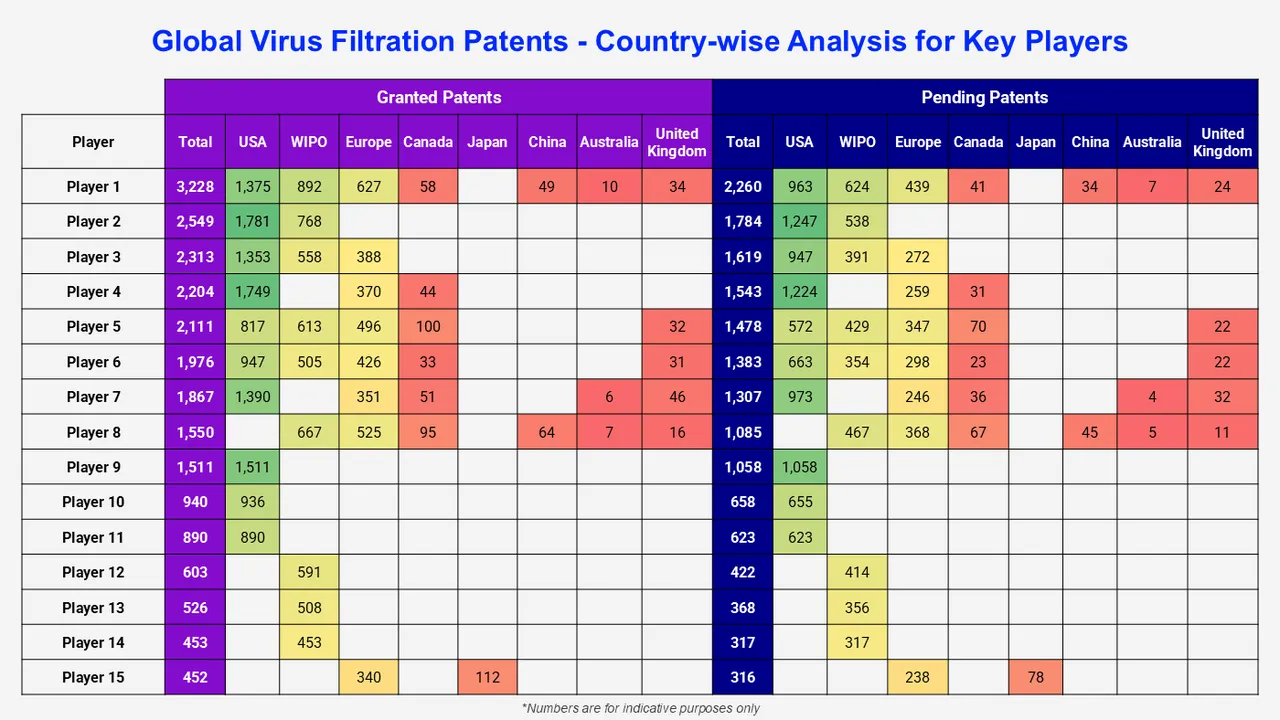
The United States is one of the leading jurisdictions for virus filtration patents, having around 208,000+ patents. The presence of big companies, well-established healthcare infrastructure, and advanced research and development activities contributes to the regional patent landscape significantly.

Patent Profile of Key Companies

Among the players with virus filtration patent families, new entrants have been identified, which can be either established companies or startups developing their first technology in the virus filtration field. Some of the major companies mentioned in this report (a non-exhaustive list) are as follows:

Genentech Inc.

A biotechnology business that was established in 1976 and has its main office in San Francisco, California, it is a pioneer in the creation and production of biopharmaceuticals. The company uses cutting-edge virus filtration technologies to ensure product safety and specializes in the discovery and production of medications for severe medical conditions. Genentech is renowned for its excellent biologic strategies, especially in the fields of neuroscience, immunology, and oncology.

Other companies include Human Genome Sciences Inc, Radiatric Inc., Biolitec Holding Gmbh & Co Kg, Air Force-Field Systems Llc, Bristol Myers Squibb Co., Novozymes As, F. Hoffmann La Roche, Novartis AG, Amgen Inc, Massachusetts Inst Technology, Dexcom Inc., among others.

Reasons to Purchase this Report

The virus filtration patent report provides information on the intellectual property (IP) position and strategy of key players. This report can help companies and players looking to enter or invest in this field by -

  • Competitive Advantage: The landscape reveals the market leaders, potential partners and innovators and makes it understandable which companies have important patents in this field of virus filtration.
  • Innovation Insights: The patent analysis reveals new innovations and technologies in Virus Filtration.
  • Market Positioning: Companies with strong patent portfolios gain a competitive advantage because their intellectual property assets differentiate their products. Understanding their intellectual property strategy reveals the market position of new entrants and potential barriers to entry with in osmometer patent landscape.
  • Risk Assessment: In technology-intensive fields such as virus filtration, risks of IP infringement are common. Analyzing patent landscapes helps companies assess risk, develop mitigation strategies, and inform licensing, partnering, and acquisition decisions.

Key Questions Answered in the Virus Filtration Patent Landscape Report

  • Who are the key players in the virus filtration patent landscape?
  • How is the patent portfolio distributed geographically?
  • What are the emerging trends in virus filtration patents?
  • How has the patent landscape evolved over time?
  • What are the strategic insights for market players and investors?
  • What is the technological focus of patents in the virus filtration industry?
  • How do patent strategies impact competitive advantage?
  • What are the implications of patent filings in virus filtration?
  • What are the challenges and opportunities in the virus filtration patent landscape?
  • What are the regulatory and legal considerations?
  • What technological innovations have recently emerged in virus filtration?

Related Reports

Global Zika Virus Therapeutics Market

Global Virus Cancer Therapy Market

Global Membrane Filtration Market

*While we strive to always give you current and accurate information, the numbers depicted on the website are indicative and may differ from the actual numbers in the main report. At Expert Market Research, we aim to bring you the latest insights and trends in the market. Using our analyses and forecasts, stakeholders can understand the market dynamics, navigate challenges, and capitalize on opportunities to make data-driven strategic decisions.*

Looking for specific insights?

Get in touch with us for a customized solution tailored to your unique requirements and save upto 35%!

Report Summary

Explore our key highlights of the report and gain a concise overview of key findings, trends, and actionable insights that will empower your strategic decisions.

Key Highlights of the Report

Please note that the figures mentioned in the description serve as estimates and may vary from the actual figures presented in the final report.

Scope of the Report

Details

Analysis by Product

  • Filtration Systems
  • Kits & Reagents
  • Services

Analysis by Application

  • Medical Devices
  • Water Purification
  • Air Purification
  • Biological
    • Vaccines and Therapeutics
    • Blood and Blood Products
    • Cellular and Gene Therapy Products
    • Tissue and Tissue Products
  • Others

Key Players Mentioned


  • Genentech Inc.
  • Gilead Sciences Inc.
  • Human Genome Sciences Inc.
  • Radiatric Inc.
  • Biolitec Holding Gmbh & Co Kg
  • Air Force-Field Systems Llc
  • Bristol Myers Squibb Co
  • Novozymes As
  • F. Hoffmann La Roche
  • Novartis AG
  • Amgen Inc.
  • Massachusetts Inst Technology
  • Dexcom Inc.
  • Others

Geographies Covered

  • North America
  • Europe
  • Asia Pacific
  • Others

Mini Report

10 % Off

USD

2,699

2,429

Single User License

10 % Off

USD

4,299

3,869

Five User License

15 % Off

USD

5,799

4,949

Corporate License

15 % Off

USD

6,999

5,949

  • Purchase Advantages
  • Report Delivery
  • Access Duration
  • Analyst Support
  • Discount on Future Updates
  • Customisation Options
  • Customisation Requests
  • 1 Print Allowed
  • Upto 3 Sections
  • Bulk Purchase Discounts
  • Multi-Device Access
  • PDF Format
  • Online Access
  • Excel Data Sheet
  • PPT/Word Format
  • Unlimited Access
  • One-Time Purchase
  • Annual Subscription
  • 3 Years Subscription
  • Email Support
  • Phone Support
  • Up to 15 Analyst Hours
  • Up to 30 Analyst Hours
  • 5% Discount
  • 10% Discount
  • 15% Discount
  • 20% Discount
  • Basic (Up to 10%)
  • Advanced (Up to 50%)
  • Dedicated Analyst Access
  • Consultations Hours
  • Custom Data Queries
  • Custom Report Layouts
  • Tailored Custom Summaries
  • Dashboard
  • Purchase Advantages
  • Report Delivery
  • Access Duration
  • Analyst Support
  • Discount on Future Updates
  • Customisation Options
  • Customisation Requests
  • 1 Print Allowed
  • Full Report Access
  • Bulk Purchase Discounts
  • Multi-Device Access
  • PDF Format
  • Online Access
  • Excel Data Sheet
  • PPT/Word Format
  • Unlimited Access
  • One-Time Purchase
  • Annual Subscription
  • 3 Years Subscription
  • Email Support
  • Phone Support
  • Up to 15 Analyst Hours
  • Up to 30 Analyst Hours
  • 10% Discount
  • 5% Discount
  • 15% Discount
  • 20% Discount
  • Basic (Up to 10%)
  • Advanced (Up to 50%)
  • Dedicated Analyst Access
  • Consultations Hours
  • Custom Data Queries
  • Custom Report Layouts
  • Tailored Custom Summaries
  • Dashboard
  • Purchase Advantages
  • Analyst Support
  • Report Delivery
  • Access Duration
  • Customisation Options
  • Discount on Future Updates
  • Customisation Requests
  • 5 Prints Allowed
  • Full Report Access
  • Bulk Purchase Discounts
  • Limited Device Access
  • Email Support
  • Phone Support
  • Up to 15 Analyst Hours
  • Up to 30 Analyst Hours
  • PDF Format
  • Online Access
  • Excel Data Sheet
  • PPT/Word Format
  • Unlimited Access
  • One-Time Purchase
  • Annual Subscription
  • 3 Years Subscription
  • Basic (Up to 10%)
  • Advanced (Up to 50%)
  • Dedicated Analyst Access
  • Consultations Hours
  • 15% Discount
  • 5% Discount
  • 10% Discount
  • 20% Discount
  • Custom Data Queries
  • Custom Report Layouts
  • Tailored Custom Summaries
  • Dashboard
  • Report Delivery
  • Purchase Advantages
  • Customisation Options
  • Analyst Support
  • Customisation Requests
  • Access Duration
  • Discount on Future Updates
  • PDF Format
  • Excel Data Sheet
  • PPT/Word Format
  • Online Access
  • 1 Print Allowed
  • Full Report Access
  • Bulk Purchase Discounts
  • Multi-Device Access
  • Basic (Up to 10%)
  • Advanced (Up to 50%)
  • Dedicated Analyst Access
  • Consultations Hours
  • Email Support
  • Phone Support
  • Up to 15 Analyst Hours
  • Up to 30 Analyst Hours
  • Custom Data Queries
  • Custom Report Layouts
  • Tailored Custom Summaries
  • Dashboard
  • Unlimited Access
  • One-Time Purchase
  • Annual Subscription
  • 3 Years Subscription
  • 20% Discount
  • 5% Discount
  • 10% Discount
  • 15% Discount

Mini Report

One User

USD 2,699

USD 2,429

tax inclusive*

  • Selected Segments
  • Printing Restrictions
  • Excel Spreadsheet Delivered via Email
  • Full Report
  • Periodic Updates
  • Post Sales Analysts Support
  • Unlimited Prints

Single User License

One User

USD 4,299

USD 3,869

tax inclusive*

  • Selected Segments
  • Printing Restrictions
  • PDF Delivered via Email
  • Custom Report Layout
  • Post Sales Analysts Support
  • Periodic Updates
  • Unlimited Prints

Five User License

Five User

USD 5,799

USD 4,949

tax inclusive*

  • All Selected Segments
  • Five Prints Available
  • PDF Delivered via Email
  • Limited Free Customization
  • Post Sales Analyst Support
  • Custom Report Layout
  • Periodic Updates
  • Unlimited Prints

Corporate License

Unlimited Users

USD 6,999

USD 5,949

tax inclusive*

  • All Selected Segments
  • Unlimited Prints Available
  • PDF & Excel Delivery via Email
  • Limited Free Customization
  • Post Sales Analysts Support
  • Discount On Next Update
  • Custom Report Layout

*Please note that the prices mentioned below are starting prices for each bundle type. Kindly contact our team for further details.*

Bundle Type

Flash Bundle

20% OFF Number of Reports: 3

Small Business Bundle

25% OFF Number of Reports: 5

Growth Bundle

30% OFF Number of Reports: 8

Enterprise Bundle

35% OFF Number of Reports: 10
Overview
  • Life Time Access
  • Analyst Support Related to Report
  • PDF Version of the Report
  • Complimentary Excel Data Set
  • Free Analyst Hours
  • Complimentary Free 1 Month Subscription to Trade Data Base
  • Complimentary One Month Subscription to Price Database (Chemicals only)
  • Complementary PPT Version of the Report
  • Complimentary License Upgrade
  • Complimentary Power BI Dashboards
  • Life Time Access
  • Analyst Support Related to Report
  • PDF Version of the Report
  • Complimentary Excel Data Set
  • Free Analyst Hours - 50 Hours
  • Complimentary Free 1 Month Subscription to Trade Data Base
  • Complimentary One Month Subscription to Price Database (Chemicals only)
  • Complementary PPT Version of the Report
  • Complimentary License Upgrade
  • Complimentary Power BI Dashboards
  • Life Time Access
  • Analyst Support Related to Report
  • PDF Version of the Report
  • Complimentary Excel Data Set
  • Free Analyst Hours - 80 Hours
  • Complimentary Free 1 Month Subscription to Trade Data Base
  • Complimentary One Month Subscription to Price Database (Chemicals only)
  • Complementary PPT Version of the Report
  • Complimentary License Upgrade
  • Complimentary Power BI Dashboards
  • Life Time Access
  • Analyst Support Related to Report
  • PDF Version of the Report
  • Complimentary Excel Data Set
  • Free Analyst Hours - 100 Hours
  • Complimentary Free 1 Month Subscription to Trade Data Base
  • Complimentary One Month Subscription to Price Database (Chemicals only)
  • Complementary PPT Version of the Report
  • Complimentary License Upgrade
  • Complimentary Power BI Dashboards

*Please note that the prices mentioned below are starting prices for each bundle type. Kindly contact our team for further details.*

Flash Bundle

Number of Reports: 3

20%

tax inclusive*

  • 3 Reports Included
  • Life Time Acess
  • Analyst Support Related to Report
  • PDF Version of the Report
  • Free 1 Month Subscription to Trade Data Base
  • 1 Month Subscription to Price Database (Chemicals only)
  • Complimentary Excel Data Set
  • PPT Version of the Report
  • Power BI Dashboards
  • License Upgrade
  • Free Analyst Hours

Small Business Bundle

Number of Reports: 5

25%

tax inclusive*

  • 5 Reports Included
  • Life Time Acess
  • Analyst Support Related to Report
  • PDF Version of the Report
  • Complimentary Excel Data Set
  • Free Analyst Hours - 50 Hours
  • Free 1 Month Subscription to Trade Data Base
  • 1 Month Subscription to Price Database (Chemicals only)
  • Complimentary Excel Data Set
  • PPT Version of the Report
  • Power BI Dashboards
  • License Upgrade

Growth Bundle

Number of Reports: 8

30%

tax inclusive*

  • 8 Reports Included
  • Life Time Acess
  • Analyst Support Related to Report
  • PDF Version of the Report
  • Complimentary Excel Data Set
  • Free Analyst Hours - 50 Hours
  • Free 1 Month Subscription to Trade Data Base
  • 1 Month Subscription to Price Database (Chemicals only)
  • License Upgrade
  • Free Analyst Hours - 80 Hours
  • Power BI Dashboards

Enterprise Bundle

Number of Reports: 10

35%

tax inclusive*

  • 10 Reports Included
  • Life Time Acess
  • Analyst Support Related to Report
  • PDF Version of the Report
  • Complimentary Excel Data Set
  • Free Analyst Hours - 50 Hours
  • Free 1 Month Subscription to Trade Data Base
  • 1 Month Subscription to Price Database (Chemicals only)
  • License Upgrade
  • Power BI Dashboards
  • Free Analyst Hours - 100 Hours

How To Order

Our step-by-step guide will help you select, purchase, and access your reports swiftly, ensuring you get the information that drives your decisions, right when you need it.

Select License Type

Choose the right license for your needs and access rights.

Click on ‘Buy Now’

Add the report to your cart with one click and proceed to register.

Select Mode of Payment

Choose a payment option for a secure checkout. You will be redirected accordingly.

Strategic Solutions for Informed Decision-Making

Connect For More Information

Our expert team of analysts will offer full support and resolve any queries regarding the report, before and after the purchase.

Our expert team of analysts will offer full support and resolve any queries regarding the report, before and after the purchase.

We employ meticulous research methods, blending advanced analytics and expert insights to deliver accurate, actionable industry intelligence, staying ahead of competitors.

Our skilled analysts offer unparalleled competitive advantage with detailed insights on current and emerging markets, ensuring your strategic edge.

We offer an in-depth yet simplified presentation of industry insights and analysis to meet your specific requirements effectively.

We’re here to help answer any questions about our products and services.

Contact us

Our Offices


Australia

63 Fiona Drive, Tamworth, NSW

+61-448-061-727

India

C130 Sector 2 Noida, Uttar Pradesh 201301

+91-858-608-1494

Philippines

40th Floor, PBCom Tower, 6795 Ayala Avenue Cor V.A Rufino St. Makati City,1226.

+63-287-899-028, +63-967-048-3306

United Kingdom

6 Gardner Place, Becketts Close, Feltham TW14 0BX, Greater London

+44-753-713-2163

United States

30 North Gould Street, Sheridan, WY 82801

+1-415-325-5166

Vietnam

193/26/4 St.no.6, Ward Binh Hung Hoa, Binh Tan District, Ho Chi Minh City

+84-865-399-124

30 North Gould Street, Sheridan, WY 82801

+1-415-325-5166

63 Fiona Drive, Tamworth, NSW

+61-448-061-727

C130 Sector 2 Noida, Uttar Pradesh 201301

+91-858-608-1494

40th Floor, PBCom Tower, 6795 Ayala Avenue Cor V.A Rufino St. Makati City, 1226.

+63-287-899-028, +63-967-048-3306

6 Gardner Place, Becketts Close, Feltham TW14 0BX, Greater London

+44-753-713-2163

193/26/4 St.no.6, Ward Binh Hung Hoa, Binh Tan District, Ho Chi Minh City

+84-865-399-124