

Consumer Insights
Uncover trends and behaviors shaping consumer choices today
Procurement Insights
Optimize your sourcing strategy with key market data
Industry Stats
Stay ahead with the latest trends and market analysis.

The global near-infrared spectroscopy market was valued at USD 635.30 Million in 2025. It is expected to grow at a CAGR of 5.70% during the forecast period of 2026-2035, reaching a value of USD 1105.93 Million by 2035.The market is driven by the growing technological advancements such as enhanced detector sensitivity, improved accuracy, and reliability. The use of near-infrared spectroscopy in multiple applications including pharmaceuticals and medical diagnostics has influenced the patent landscape significantly.
The innovations in spectroscopic instrumentation include advancements in detectors, light sources, and signal processing algorithms impacting the patent landscape positively.
The expanding applications of near-infrared spectroscopy due to its non-invasive nature including brain function monitoring, and tissue oxygen monitoring, among others has fueled the patent filings across multiple medical applications.
The number of patent filings is increasing in several jurisdictions, particularly United States, and Europe. This surge can be attributed to the presence of large healthcare companies, universities and academic institutions investing heavily in research to develop innovative products in near-infrared spectroscopy field.
The global near-infrared spectroscopy patent landscape report provides comprehensive and in-depth analysis of the patents in the industry. The key sections captured in the report for near-infrared spectroscopy includes a thorough examination of the patent portfolios of key players, covering aspects such as the number of patents held, year of publication and types of technologies patented. It includes the latest trends, geographical distribution of patents, top IP player profiles, technological segmentation, and patent valuation. The breakdown of patents by technical segments is provided, giving more clarity on the specific areas of innovation within near-infrared spectroscopy technologies.
Recent studies have shown the potential of near-infrared spectroscopy in several medical applications, including analytical tools for disease diagnosis, and analysis of the brain and other tissues. The broad applicability of near-infrared spectroscopy facilitates the diagnosis and therapy of diseases. These expanding applications in the medical field have led to patent filings by the companies to protect their intellectual property rights.
Near-infrared spectroscopy is a spectroscopic method which uses near-infrared region of the electromagnetic spectrum ranging from 780 nm to 2500 nm. The applications include medical and physiological diagnostics including pulse oximeters, blood glucose monitoring, functional neuroimaging, brain computer interface, urology, and neurology. Near-infrared spectroscopy is non-destructive and requires little or no sample preparation. The development of innovative technologies utilizing near-infrared spectroscopy impacting patent filings.
Advances in Technologies such as Light Sources and Detector Enhancement is Expected to Augment the Patent Industry Growth
Innovations in near-infrared spectroscopy instrumentation, such as improvements in light sources, optical components, and detectors, drive the patent landscape. The advancements aim to enhance the accuracy and resolution of near-infrared spectroscopy measurements.
The patents are also focusing on miniaturizing the devices and developing portable spectrometers. This development supports applications in point-of-care diagnostics, and wearable monitoring devices.
Diverse Applications led to Patent Filing is Expected to Augment the Patent Industry Growth
The near-infrared spectroscopy technology for medical areas is growing due to expanding applications including genetics, and infectious diseases. In pharmaceuticals, near-infrared spectroscopy is used in drug development, quality control of pharmaceutical formulations, and real-time monitoring of manufacturing processes.
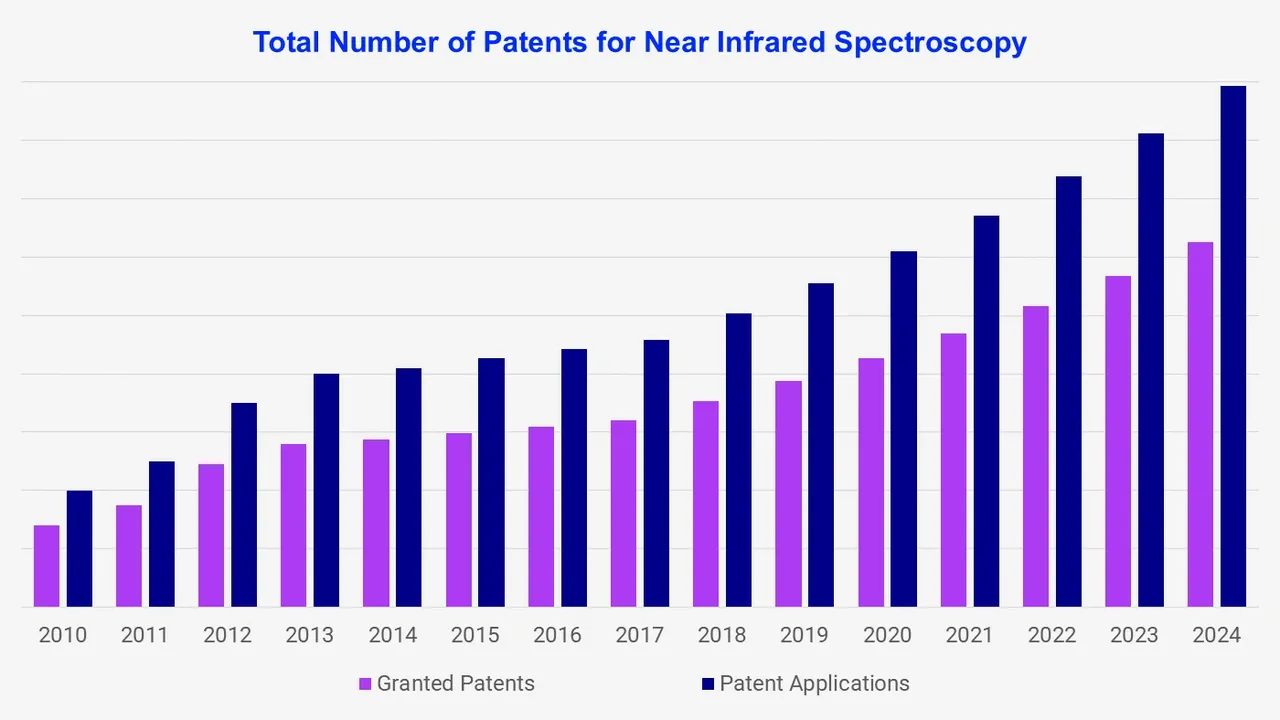
Moreover, it is used for monitoring the brain activity. It enables measure ment of changes in oxyhemoglobin and deoxyhemoglobin, which reflect local brain activity. It also enables non-invasive measurement of oxygenation in local tissue. The number of patents granted increased from 430 in 2022 to 444 in 2023. The expanding application signifying the need for patent registration. Companies are filing patents to protect inventions and impacting the patent landscape.
Breakup by Type
The report will cover the following sections in detail:
The breakup based on type includes dispersive spectrometers, FT-NIR spectrometers. Near-infrared spectroscopy investigations have been conducted with the chosen patent families labelled based on the platforms to which they pertain.
Dispersive spectrometers analyze the near-infrared spectrum by dispersing light into its component wavelengths by using a prism. This device measures the intensity of light at different wavelengths. It is used in various applications such as pharmaceuticals, diagnostics, and food quality control among others.
The detailed technological data will be provided for all specified segments classified in this report.
The United States is one of the leading jurisdictions for Near-Infrared Spectroscopy patents, having around 9,000+ patents. The presence of robust legal framework and advanced research and development activities contributes to the patent landscape significantly for the region.
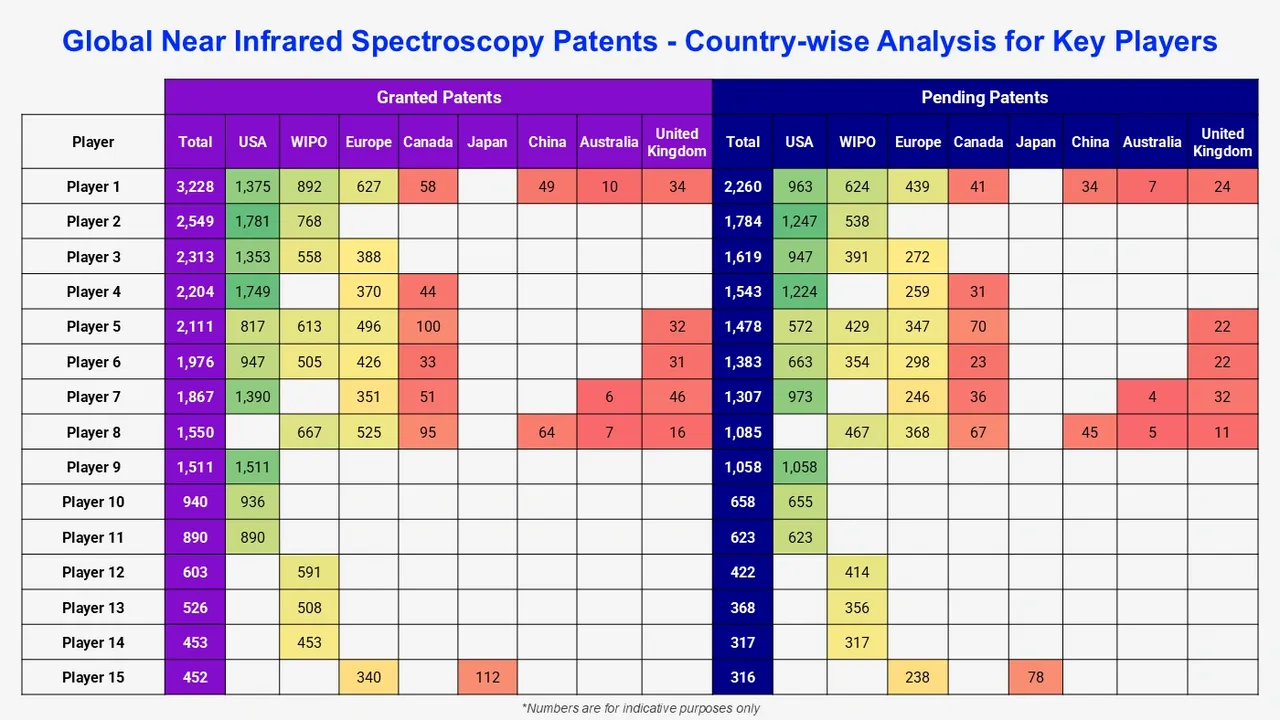
Among the players with near-infrared spectroscopy patent families, new entrants have been identified, which can be either established companies or startups developing their first technology in the field. Some of the major companies mentioned in this report (a non-exhaustive list) are as follows:
Life Technologies Corp
Life Technologies Corporation, a ThermoFisher company founded in 2008, formed by merger of Invitrogen Corporation and Applied Biosystems Inc. The company is holding patent in the field of near-infrared spectroscopy.
Other companies include Nvidia Corp, Dexcom Inc., Ethicon LLC, Purdue Pharma Lp, Optiscan Biomedical Corp, Inscripta Inc., Cilag GmBh Int., Tran Bao, Regeneron Pharma, Progenity Inc., and Leaf Healthcare Inc. among others.
The near-infrared spectroscopy patent report provides information on the intellectual property (IP) position and strategy of key players. This report can help companies and players looking to enter or invest in this field by -
Global Atomic Spectroscopy Market
Global Process Spectroscopy Market


Upto 15% Off
USD
$2699 $2429
$4299 $3869
$5799 $4949
$6999 $5949


*While we strive to always give you current and accurate information, the numbers depicted on the website are indicative and may differ from the actual numbers in the main report. At Expert Market Research, we aim to bring you the latest insights and trends in the market. Using our analyses and forecasts, stakeholders can understand the market dynamics, navigate challenges, and capitalize on opportunities to make data-driven strategic decisions.*
Get in touch with us for a customized solution tailored to your unique requirements and save upto 35%!
Explore our key highlights of the report and gain a concise overview of key findings, trends, and actionable insights that will empower your strategic decisions.
|
Scope of the Report |
Details |
|
Analysis by Type |
|
|
Target Indication |
|
|
Target Antigen |
|
|
Key Players Mentioned |
|
|
Geographies Covered |
|
Mini Report
One User
USD 2,699
USD 2,429
tax inclusive*
Single User License
One User
USD 4,299
USD 3,869
tax inclusive*
Five User License
Five User
USD 5,799
USD 4,949
tax inclusive*
Corporate License
Unlimited Users
USD 6,999
USD 5,949
tax inclusive*
*Please note that the prices mentioned below are starting prices for each bundle type. Kindly contact our team for further details.*
Flash Bundle
Small Business Bundle
Growth Bundle
Enterprise Bundle
*Please note that the prices mentioned below are starting prices for each bundle type. Kindly contact our team for further details.*
Flash Bundle
Number of Reports: 3
20%
tax inclusive*
Small Business Bundle
Number of Reports: 5
25%
tax inclusive*
Growth Bundle
Number of Reports: 8
30%
tax inclusive*
Enterprise Bundle
Number of Reports: 10
35%
tax inclusive*
How To Order

Select License Type
Choose the right license for your needs and access rights.

Click on ‘Buy Now’
Add the report to your cart with one click and proceed to register.

Select Mode of Payment
Choose a payment option for a secure checkout. You will be redirected accordingly.
Gain insights to stay ahead and seize opportunities.

Get insights & trends for a competitive edge.

Track prices with detailed trend reports.

Analyse trade data for supply chain insights.

Leverage cost reports for smart savings

Enhance supply chain with partnerships.

Connect For More Information
Our expert team of analysts will offer full support and resolve any queries regarding the report, before and after the purchase.
Our expert team of analysts will offer full support and resolve any queries regarding the report, before and after the purchase.
We employ meticulous research methods, blending advanced analytics and expert insights to deliver accurate, actionable industry intelligence, staying ahead of competitors.
Our skilled analysts offer unparalleled competitive advantage with detailed insights on current and emerging markets, ensuring your strategic edge.
We offer an in-depth yet simplified presentation of industry insights and analysis to meet your specific requirements effectively.


Share