Explore Our Diverse Range Of Offerings
From detailed reports to experts services offered in 15+ Industry Domains
Report
Press Release
Blogs
Industry Statistics
Add 2 More Reports For 20% off

Report Overview

In children, cerebral palsy (CP) is the most prevalent motor disability. According to recent global population-based studies, the prevalence of cerebral palsy (CP) ranges from 1 to almost 4 cases per 1,000 live births or children. Nearly 61% of all cerebral palsy patients have spastic cerebral palsy, which is still the most prevalent form of the condition.

2024

Base Year

2018-2024

Historical Year

2025-2034

Forecast Year

Spastic Cerebral Palsy Epidemiology Forecast Report Coverage

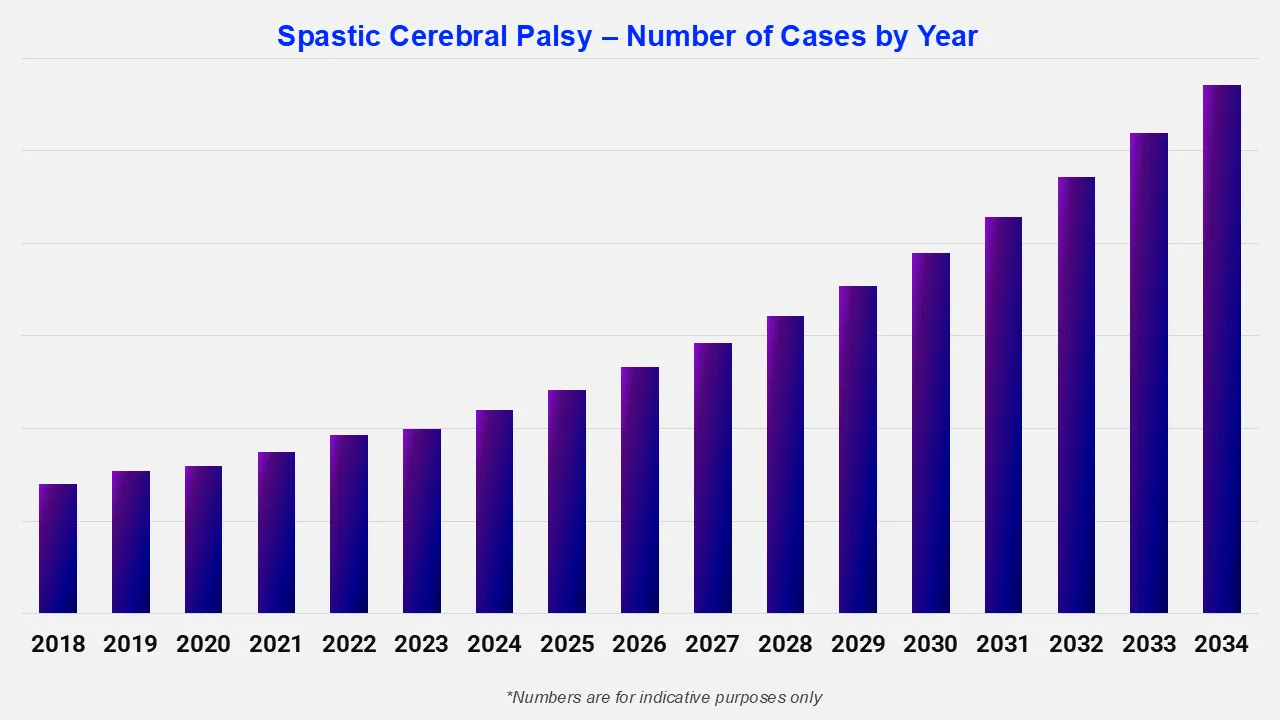
Expert Market Research's “Spastic Cerebral Palsy Epidemiology Forecast Report 2025-2034” offers comprehensive information on the prevalence and demographics of spastic cerebral palsy. It projects the future incidence and prevalence rates of spastic cerebral palsy across various populations. The study covers age, gender, and type as major determinants of the spastic cerebral palsy-affected population. The report highlights patterns in the prevalence of spastic cerebral palsy over time and projects future trends based on multiple variables.

The report provides a comprehensive overview of the disease, as well as historical and projected data on the epidemiology of spastic cerebral palsy in the 8 major markets.

Regions Covered

  • The United States
  • Germany
  • France
  • Italy
  • Spain
  • The United Kingdom
  • Japan
  • India

Spastic Cerebral Palsy Disease Overview

Spastic cerebral palsy is a neurological disorder that impairs movement and muscle coordination. It is brought on by brain damage that occurs prior to, during, or soon after birth. Exaggerated reflexes, difficulty with voluntary movements, and muscle stiffness (spasticity) are the characteristics of this type of cerebral palsy. Walking, posture, and fine motor skills can all be affected by the condition, which mainly affects the motor cortex and can affect one or more limbs. The severity varies; some people have minor mobility issues, while others have severe mobility impairments.

Spastic Cerebral Palsy: Treatment Overview

The goal of treatment for spastic cerebral palsy is to improve mobility and manage symptoms through a combination of therapies and medical interventions. Occupational and physical therapy improve everyday functioning, flexibility, and muscle control. To reduce spasticity, doctors may prescribe drugs like muscle relaxants (like baclofen or botulinum toxin). In extreme situations, orthopaedic surgery or selective dorsal rhizotomy (SDR) can help with posture and movement. Depending on the needs of everyone, assistive technology, orthotics, and speech therapy may also be included.

Epidemiology

The spastic cerebral palsy epidemiology section offers information on the patient pool from history to the present as well as the projected trend for each of the 8 major markets. Expert Market Research provides both current and predicted trends for spastic cerebral palsy by examining a wide range of studies. Additionally, the report covers the diagnosed patient pool for spastic cerebral palsy and their trends. The data is broken down into specific categories, such as total prevalent cases in males and females, and total diagnosed cases across different age groups and patient pools.

  • According to the Cerebral Palsy Alliance Research Foundation (CPARF), spastic cerebral palsy (CP) accounts for 70–80% of all cases of CP, making it the most prevalent type. Extreme muscle tension brought on by this kind of CP can paralyze half of the body, all four limbs, or two limbs.
  • An article addressed that 30% of spastic cerebral palsy cases are unilateral in nature while 69% cases of spastic cerebral palsy are bilateral in nature. The percentage of cases of spastic cerebral palsy that are unaccounted for is 0.7%.
  • According to a study conducted in India, around 32.22% of the children affected by the condition were between the ages of 48 and 96 months, and 67.57% of the children were male. According to the classification, 77.34% of patients had a spastic form of cerebral palsy, with diplegic cerebral palsy being the most prevalent with around 42.83%.
  • According to the Cerebral Palsy Research Network, it is estimated that 1 in 345 Americans suffer from cerebral palsy. Of the children diagnosed with cerebral palsy, the majority (82.9%) had spastic cerebral palsy.

Country-wise Spastic Cerebral Palsy Epidemiology

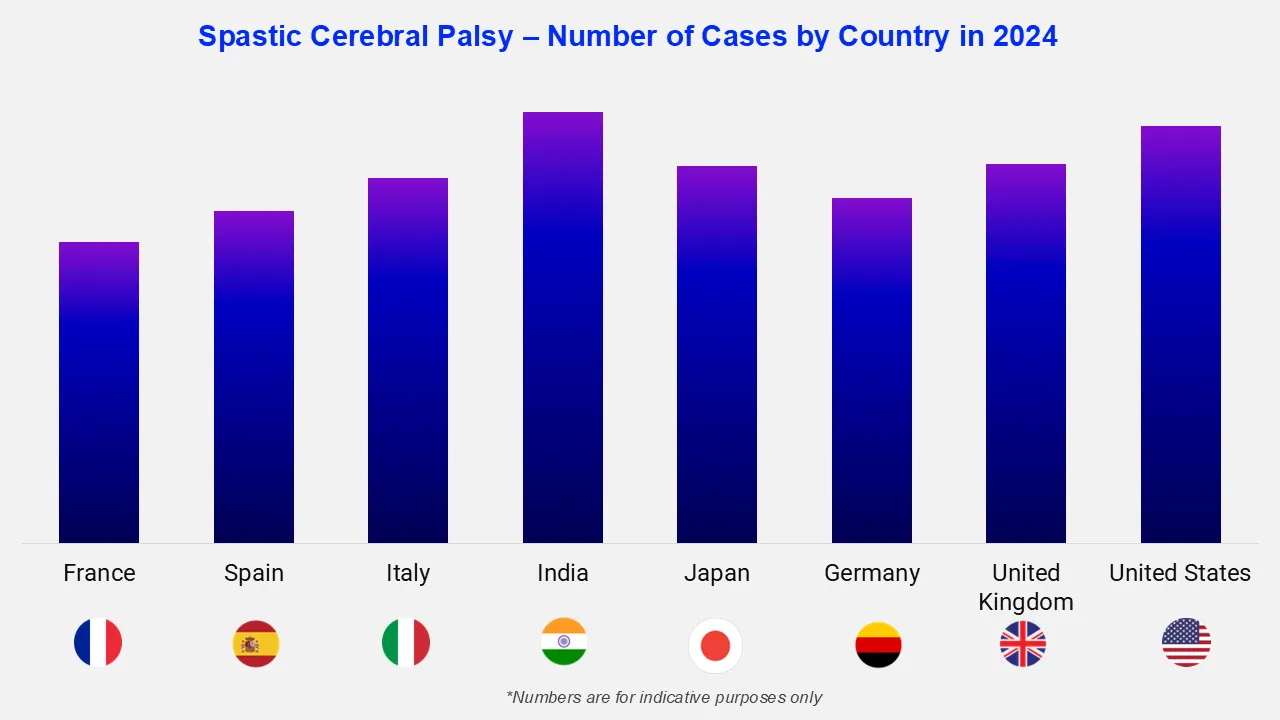
The spastic cerebral palsy epidemiology data and findings for the United States, Germany, Spain, Italy, France, the United Kingdom, Japan, and India are also provided in the epidemiology section.

The epidemiology of spastic cerebral palsy varies between countries, owing to the differences in factors such as high rates of preterm births, delayed access to neonatal care, poor maternal healthcare, and infections like meningitis, malaria, etc. According to the Centers for Disease Control and Prevention Metropolitan Atlanta Developmental Disabilities Surveillance Program, the first multi-state study examined the prevalence of cerebral palsy in children aged 8 in southeastern Wisconsin, northern Alabama, and metropolitan Atlanta. Analysis was done on 114,897 children's data. There were 3.6 cases of cerebral palsy for every 1,000 children. Accounting for 76.9% of all cases, spastic cerebral palsy was the most prevalent type.

Country Specific Stats:

Country

Prevalence (Unit)

United States

XX

United Kingdom

XX

Germany

XX

Italy

XX

France

XX

Spain

XX

Japan

XX

India

XX

Scope of the Report

  • The report covers a detailed analysis of signs and symptoms, causes, risk factors, pathophysiology, diagnosis, treatment options, and classification/types of Spastic Cerebral Palsy based on several factors.
  • Spastic Cerebral Palsy Epidemiology Forecast Report covers data for the eight major markets (the US, France, Germany, Italy, Spain, the UK, Japan, and India).
  • The report helps to identify the patient population, and the unmet needs of Spastic Cerebral Palsy are highlighted along with an assessment of the disease's risk and burden.

Key Questions Answered

  • What are the key findings of spastic cerebral palsy epidemiology in the 8 major markets?
  • What will be the total number of patients with spastic cerebral palsy across the 8 major markets during the forecast period?
  • What was the country-wise prevalence of spastic cerebral palsy in the 8 major markets in the historical period?
  • Which country will have the highest number of spastic cerebral palsy patients during the forecast period of 2025-2034?
  • Which key factors would influence the shift in the patient population of spastic cerebral palsy during the forecast period of 2025-2034?
  • What are the currently available treatments for spastic cerebral palsy?
  • What are the disease risks, signs, symptoms, and unmet needs of spastic cerebral palsy?

Related Reports

Global Cerebral Somatic Oximeters Market

Global Cerebral Oximetry Monitoring Market

*While we strive to always give you current and accurate information, the numbers depicted on the website are indicative and may differ from the actual numbers in the main report. At Expert Market Research, we aim to bring you the latest insights and trends in the market. Using our analyses and forecasts, stakeholders can understand the market dynamics, navigate challenges, and capitalize on opportunities to make data-driven strategic decisions.*

Looking for specific insights?

Get in touch with us for a customized solution tailored to your unique requirements and save upto 35%!

Report Summary

Explore our key highlights of the report and gain a concise overview of key findings, trends, and actionable insights that will empower your strategic decisions.

Key Highlights of the Report

Please note that the figures mentioned in the description serve as estimates and may vary from the actual figures presented in the final report.

Report Features

Details

Base Year

2024

Historical Period

2018-2024

Forecast Period

2025-2034

Epidemiology Statistics Provided

  • Diagnosed Prevalent Cases
  • Type-Specific Cases
  • Gender-Specific Cases
  • Age-Specific Cases

Segmentation Provided

  • Epidemiology by Age Group
  • Epidemiology by Gender
  • Epidemiology by Type of Disease
  • Epidemiology by Region

Geographies Covered

  • United States
  • Germany
  • Italy
  • France
  • Spain
  • United Kingdom
  • Japan
  • India

Single User License

10 % Off

USD

2,999

2,699

Datasheet

10 % Off

USD

1,999

1,799

Five User License

15 % Off

USD

4,399

3,739

Corporate License

15 % Off

USD

5,799

4,929

Single User License

One User

USD 2,999

USD 2,699

tax inclusive*

  • All Segments
  • Printing Restrictions
  • PDF Delivered via Email
  • Custom Report Layout
  • Post Sales Analysts Support
  • Periodic Updates
  • Unlimited Prints

Datasheet

One User

USD 1,999

USD 1,799

tax inclusive*

  • Selected Segments
  • Printing Restrictions
  • Excel Spreadsheet Delivered via Email
  • Full Report
  • Periodic Updates
  • Post Sales Analysts Support
  • Unlimited Prints

Five User License

Five User

USD 4,399

USD 3,739

tax inclusive*

  • All Segments
  • Five Prints Available
  • PDF Delivered via Email
  • Limited Free Customization
  • Post Sales Analyst Support
  • Custom Report Layout
  • Periodic Updates
  • Unlimited Prints

Corporate License

Unlimited Users

USD 5,799

USD 4,929

tax inclusive*

  • All Segments
  • Unlimited Prints Available
  • PDF & Excel Delivery via Email
  • Limited Free Customization
  • Post Sales Analysts Support
  • Discount On Next Update
  • Custom Report Layout

*Please note that the prices mentioned below are starting prices for each bundle type. Kindly contact our team for further details.*

Bundle Type

Flash Bundle

20% OFF Number of Reports: 3

Small Business Bundle

25% OFF Number of Reports: 5

Growth Bundle

30% OFF Number of Reports: 8

Enterprise Bundle

35% OFF Number of Reports: 10
Overview
  • Life Time Access
  • Analyst Support Related to Report
  • PDF Version of the Report
  • Complimentary Excel Data Set
  • Free Analyst Hours
  • Complimentary Free 1 Month Subscription to Trade Data Base
  • Complimentary One Month Subscription to Price Database (Chemicals only)
  • Complementary PPT Version of the Report
  • Complimentary License Upgrade
  • Complimentary Power BI Dashboards
  • Life Time Access
  • Analyst Support Related to Report
  • PDF Version of the Report
  • Complimentary Excel Data Set
  • Free Analyst Hours - 50 Hours
  • Complimentary Free 1 Month Subscription to Trade Data Base
  • Complimentary One Month Subscription to Price Database (Chemicals only)
  • Complementary PPT Version of the Report
  • Complimentary License Upgrade
  • Complimentary Power BI Dashboards
  • Life Time Access
  • Analyst Support Related to Report
  • PDF Version of the Report
  • Complimentary Excel Data Set
  • Free Analyst Hours - 80 Hours
  • Complimentary Free 1 Month Subscription to Trade Data Base
  • Complimentary One Month Subscription to Price Database (Chemicals only)
  • Complementary PPT Version of the Report
  • Complimentary License Upgrade
  • Complimentary Power BI Dashboards
  • Life Time Access
  • Analyst Support Related to Report
  • PDF Version of the Report
  • Complimentary Excel Data Set
  • Free Analyst Hours - 100 Hours
  • Complimentary Free 1 Month Subscription to Trade Data Base
  • Complimentary One Month Subscription to Price Database (Chemicals only)
  • Complementary PPT Version of the Report
  • Complimentary License Upgrade
  • Complimentary Power BI Dashboards

*Please note that the prices mentioned below are starting prices for each bundle type. Kindly contact our team for further details.*

Flash Bundle

Number of Reports: 3

20%

tax inclusive*

  • 3 Reports Included
  • Life Time Acess
  • Analyst Support Related to Report
  • PDF Version of the Report
  • Free 1 Month Subscription to Trade Data Base
  • 1 Month Subscription to Price Database (Chemicals only)
  • Complimentary Excel Data Set
  • PPT Version of the Report
  • Power BI Dashboards
  • License Upgrade
  • Free Analyst Hours

Small Business Bundle

Number of Reports: 5

25%

tax inclusive*

  • 5 Reports Included
  • Life Time Acess
  • Analyst Support Related to Report
  • PDF Version of the Report
  • Complimentary Excel Data Set
  • Free Analyst Hours - 50 Hours
  • Free 1 Month Subscription to Trade Data Base
  • 1 Month Subscription to Price Database (Chemicals only)
  • Complimentary Excel Data Set
  • PPT Version of the Report
  • Power BI Dashboards
  • License Upgrade

Growth Bundle

Number of Reports: 8

30%

tax inclusive*

  • 8 Reports Included
  • Life Time Acess
  • Analyst Support Related to Report
  • PDF Version of the Report
  • Complimentary Excel Data Set
  • Free Analyst Hours - 50 Hours
  • Free 1 Month Subscription to Trade Data Base
  • 1 Month Subscription to Price Database (Chemicals only)
  • License Upgrade
  • Free Analyst Hours - 80 Hours
  • Power BI Dashboards

Enterprise Bundle

Number of Reports: 10

35%

tax inclusive*

  • 10 Reports Included
  • Life Time Acess
  • Analyst Support Related to Report
  • PDF Version of the Report
  • Complimentary Excel Data Set
  • Free Analyst Hours - 50 Hours
  • Free 1 Month Subscription to Trade Data Base
  • 1 Month Subscription to Price Database (Chemicals only)
  • License Upgrade
  • Power BI Dashboards
  • Free Analyst Hours - 100 Hours

How To Order

Our step-by-step guide will help you select, purchase, and access your reports swiftly, ensuring you get the information that drives your decisions, right when you need it.

Select License Type

Choose the right license for your needs and access rights.

Click on ‘Buy Now’

Add the report to your cart with one click and proceed to register.

Select Mode of Payment

Choose a payment option for a secure checkout. You will be redirected accordingly.

Strategic Solutions for Informed Decision-Making

Connect For More Information

Our expert team of analysts will offer full support and resolve any queries regarding the report, before and after the purchase.

Our expert team of analysts will offer full support and resolve any queries regarding the report, before and after the purchase.

We employ meticulous research methods, blending advanced analytics and expert insights to deliver accurate, actionable industry intelligence, staying ahead of competitors.

Our skilled analysts offer unparalleled competitive advantage with detailed insights on current and emerging markets, ensuring your strategic edge.

We offer an in-depth yet simplified presentation of industry insights and analysis to meet your specific requirements effectively.

We’re here to help answer any questions about our products and services.

Contact us

Our Offices


Australia

63 Fiona Drive, Tamworth, NSW

+61-448-061-727

India

C130 Sector 2 Noida, Uttar Pradesh 201301

+91-723-689-1189

Philippines

40th Floor, PBCom Tower, 6795 Ayala Avenue Cor V.A Rufino St. Makati City,1226.

+63-287-899-028, +63-967-048-3306

United Kingdom

6 Gardner Place, Becketts Close, Feltham TW14 0BX, Greater London

+44-753-713-2163

United States

30 North Gould Street, Sheridan, WY 82801

+1-415-325-5166

Vietnam

193/26/4 St.no.6, Ward Binh Hung Hoa, Binh Tan District, Ho Chi Minh City

+84-865-399-124

30 North Gould Street, Sheridan, WY 82801

+1-415-325-5166

63 Fiona Drive, Tamworth, NSW

+61-448-061-727

C130 Sector 2 Noida, Uttar Pradesh 201301

+91-723-689-1189

40th Floor, PBCom Tower, 6795 Ayala Avenue Cor V.A Rufino St. Makati City, 1226.

+63-287-899-028, +63-967-048-3306

6 Gardner Place, Becketts Close, Feltham TW14 0BX, Greater London

+44-753-713-2163

193/26/4 St.no.6, Ward Binh Hung Hoa, Binh Tan District, Ho Chi Minh City

+84-865-399-124