

Consumer Insights
Uncover trends and behaviors shaping consumer choices today
Procurement Insights
Optimize your sourcing strategy with key market data
Industry Stats
Stay ahead with the latest trends and market analysis.

The incidence of pleural effusion is difficult to determine as it is generally the manifestation of an underlying disease process. In the United States, the incidence is reported to be nearly 1.5 million cases each year, with the majority of them caused by bacterial pneumonia, pulmonary embolism, congestive heart failure, and malignancy.
Base Year
Historical Period
Forecast Period
Read more about this report - Request a Free Sample
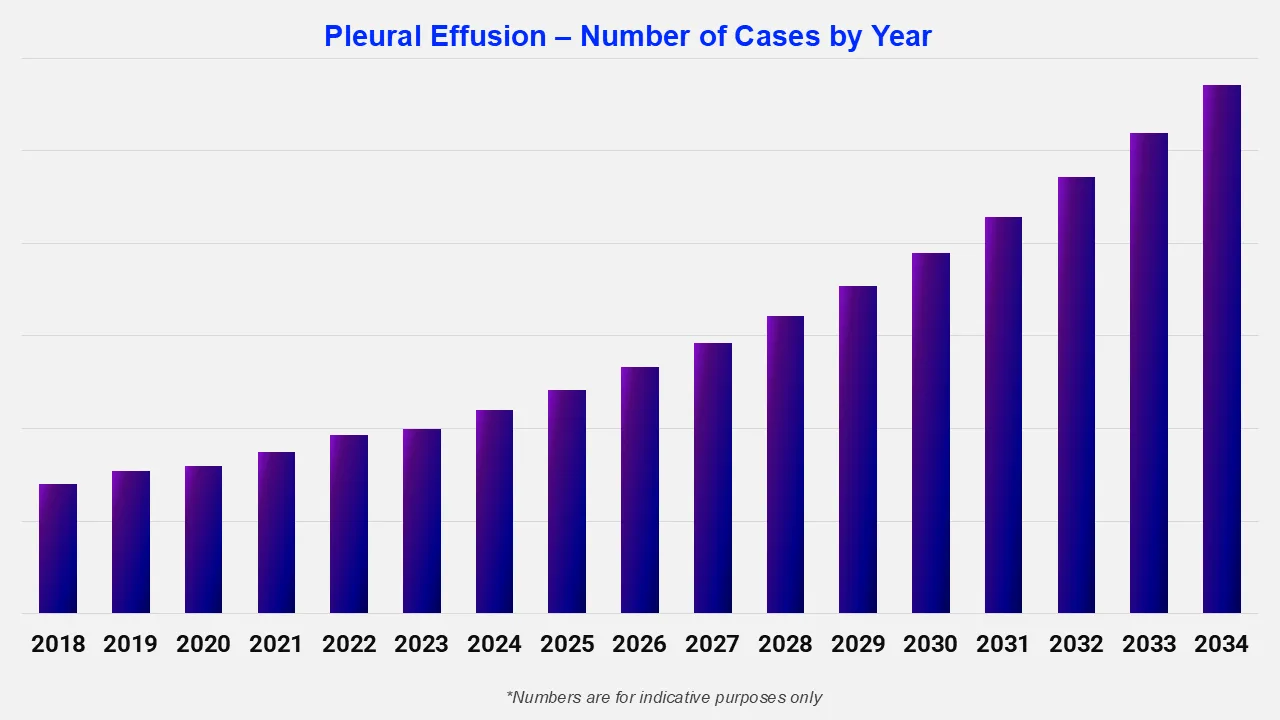
Expert Market Research's “Pleural Effusion Epidemiology Forecast Report 2026-2035” offers comprehensive information on the prevalence and demographics of pleural effusion. It projects the future incidence and prevalence rates of pleural effusion across various populations. The study covers age and type as major determinants of the pleural effusion-affected population. The report highlights patterns in the prevalence of pleural effusion over time and projects future trends based on multiple variables.
The report provides a comprehensive overview of the disease, as well as historical and projected data on the epidemiology of pleural effusion in the 8 major markets.
Regions Covered
In pleural effusion, excess fluid builds up in the pleural space, the area between the lungs and the chest wall. Transudative pleural effusion occurs when fluid leaks into the pleural space due to conditions like heart failure, cirrhosis, or kidney disease. Exudative effusion is typically caused by infection, inflammation, or cancer. Common symptoms include shortness of breath (dyspnea), chest pain, cough, and rapid heart rate, among others.
The treatment for pleural effusion depends on the underlying cause of the fluid buildup. If the effusion is caused by heart failure, diuretics like furosemide are used to reduce fluid buildup in the body. Antibiotics or antitubercular drugs are prescribed in cases where an infection is responsible for pleural effusion. Thoracentesis is commonly used for diagnosis and symptom relief, especially for larger effusions. Chest tube insertion is used for severe or persistent cases to enable continuous drainage of fluid.
The pleural effusion epidemiology section offers information on the patient pool from history to the present as well as the projected trend for each of the 8 major markets. Expert Market Research provides both current and predicted trends for pleural effusion by examining a wide range of studies. Additionally, the report covers the diagnosed patient pool for pleural effusion and their trends. The data is broken down into specific categories, such as the total diagnosed cases across different age groups and patient pools.
Read more about this report - Request a Free Sample
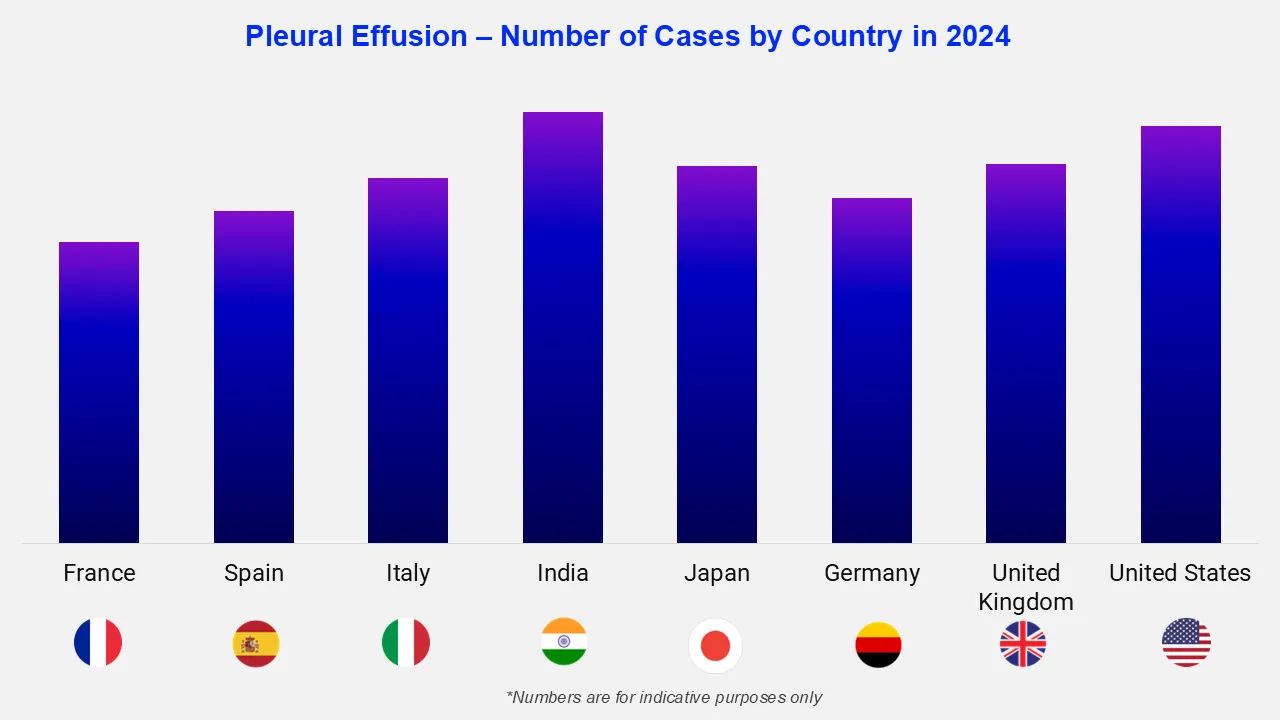
The pleural effusion epidemiology data and findings for the United States, Germany, Spain, Italy, France, the United Kingdom, Japan, and India are also provided in the epidemiology section.
The epidemiology of pleural effusion varies significantly between countries due to differences in the prevalence of underlying diseases (such as lung cancer, pneumonia, tuberculosis, and heart failure), healthcare access, diagnostic practices, environmental factors, and lifestyle patterns. In the United States, about 1.5 million patients are affected annually by pleural effusion.
Country Specific Stats:
|
Country |
Prevalence (Unit) |
|
United States |
XX |
|
United Kingdom |
XX |
|
Germany |
XX |
|
Italy |
XX |
|
France |
XX |
|
Spain |
XX |
|
Japan |
XX |
|
India |
XX |
Global Pleural Effusion Treatment Market Report and Forecast


Upto 15% Off
USD
$1999 $1799
$2999 $2699
$4399 $3739
$5799 $4929


*While we strive to always give you current and accurate information, the numbers depicted on the website are indicative and may differ from the actual numbers in the main report. At Expert Market Research, we aim to bring you the latest insights and trends in the market. Using our analyses and forecasts, stakeholders can understand the market dynamics, navigate challenges, and capitalize on opportunities to make data-driven strategic decisions.*
Get in touch with us for a customized solution tailored to your unique requirements and save upto 35%!
Explore our key highlights of the report and gain a concise overview of key findings, trends, and actionable insights that will empower your strategic decisions.
|
Report Features |
Details |
|
Base Year |
2025 |
|
Historical Period |
2019-2025 |
|
Forecast Period |
2026-2035 |
|
Geographies Covered |
|
Datasheet
One User
USD 1,999
USD 1,799
tax inclusive*
Single User License
One User
USD 2,999
USD 2,699
tax inclusive*
Five User License
Five User
USD 4,399
USD 3,739
tax inclusive*
Corporate License
Unlimited Users
USD 5,799
USD 4,929
tax inclusive*
*Please note that the prices mentioned below are starting prices for each bundle type. Kindly contact our team for further details.*
Flash Bundle
Small Business Bundle
Growth Bundle
Enterprise Bundle
*Please note that the prices mentioned below are starting prices for each bundle type. Kindly contact our team for further details.*
Flash Bundle
Number of Reports: 3
20%
tax inclusive*
Small Business Bundle
Number of Reports: 5
25%
tax inclusive*
Growth Bundle
Number of Reports: 8
30%
tax inclusive*
Enterprise Bundle
Number of Reports: 10
35%
tax inclusive*
How To Order

Select License Type
Choose the right license for your needs and access rights.

Click on ‘Buy Now’
Add the report to your cart with one click and proceed to register.

Select Mode of Payment
Choose a payment option for a secure checkout. You will be redirected accordingly.
Gain insights to stay ahead and seize opportunities.

Get insights & trends for a competitive edge.

Track prices with detailed trend reports.

Analyse trade data for supply chain insights.

Leverage cost reports for smart savings

Enhance supply chain with partnerships.

Connect For More Information
Our expert team of analysts will offer full support and resolve any queries regarding the report, before and after the purchase.
Our expert team of analysts will offer full support and resolve any queries regarding the report, before and after the purchase.
We employ meticulous research methods, blending advanced analytics and expert insights to deliver accurate, actionable industry intelligence, staying ahead of competitors.
Our skilled analysts offer unparalleled competitive advantage with detailed insights on current and emerging markets, ensuring your strategic edge.
We offer an in-depth yet simplified presentation of industry insights and analysis to meet your specific requirements effectively.


Share