Explore Our Diverse Range Of Offerings
From detailed reports to experts services offered in 15+ Industry Domains
Report
Press Release
Blogs
Industry Statistics
Add 2 More Reports For 20% off

Ocular Hypertension Epidemiology Forecast

Ocular hypertension is marked by elevated intraocular pressure (IOP), without obvious optic nerve damage or vision loss. It is estimated that between 2.7 % and 3.8% of the general population has ocular hypertension. Ocular hypertension epidemiology forecast suggests that the prevalence of ocular hypertension is influenced by age (with higher rates in older adults), ethnicity, family history, and underlying health conditions like diabetes.

2025

Base Year

2019-2025

Historical Period

2026-2035

Forecast Period

Ocular Hypertension Number Of Cases By Year

Read more about this report - Request a Free Sample

Ocular Hypertension Epidemiology Forecast Report Coverage

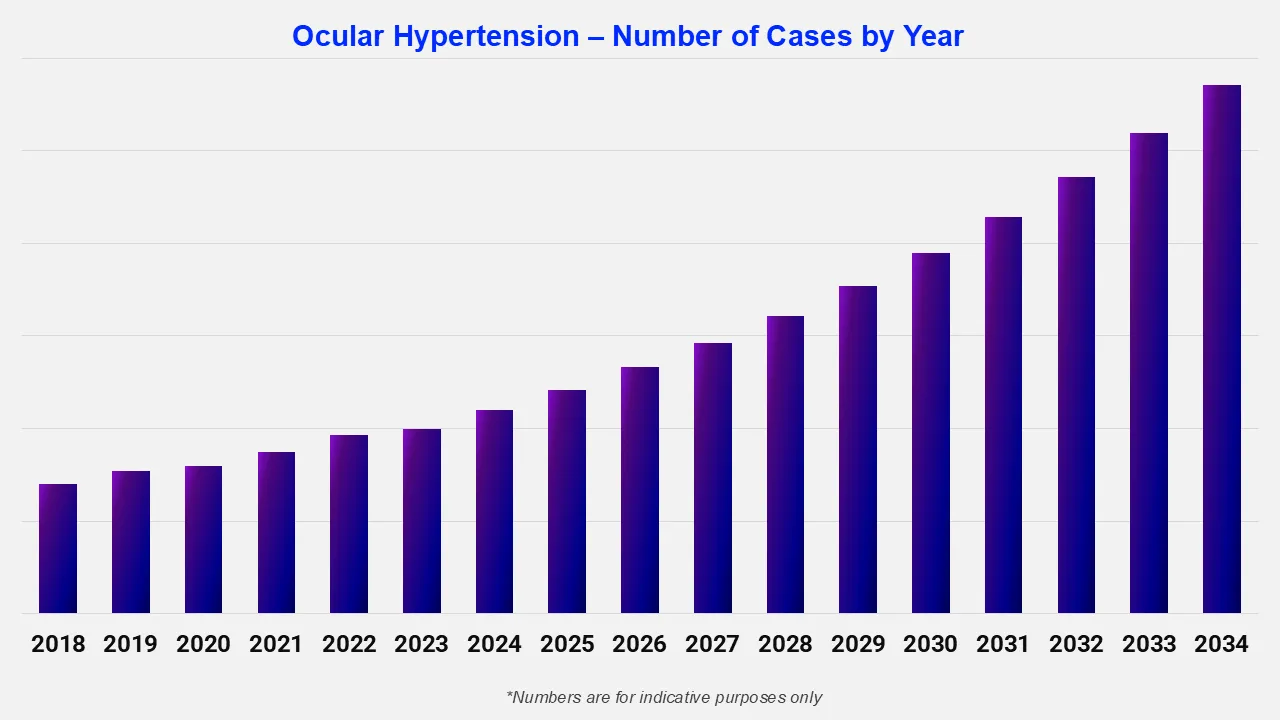
Expert Market Research's “Ocular Hypertension Epidemiology Forecast Report 2025-2034” offers comprehensive information on the prevalence and demographics of ocular hypertension. It projects the future incidence and prevalence rates of ocular hypertension cases across various populations. The study covers age and type as major determinants of the ocular hypertension population. The report highlights patterns in the prevalence of ocular hypertension over time and projects future trends based on multiple variables.

The report provides a comprehensive overview of the disease, as well as historical and projected data on ocular hypertension epidemiology in the 8 major markets.

Regions Covered

  • The United States
  • Germany
  • France
  • Italy
  • Spain
  • The United Kingdom
  • Japan
  • India

Ocular Hypertension Understanding: Disease Overview

When intraocular pressure (IOP) is higher than usual without accompanying symptoms of optic nerve damage or vision loss, it is referred to as ocular hypertension. Since long-term elevated pressure can cause nerve damage, it is regarded as a significant risk factor for glaucoma. Several factors contribute to the development of ocular hypertension, including increased production or reduced outflow of aqueous humor, age (with higher prevalence in individuals over 40), high myopia, and systemic diseases such as diabetes and hypertension. Eye trauma, decreased drainage, excessive aqueous humor production, or corticosteroid use can all cause the condition. Routine monitoring is crucial to evaluate the risk of developing glaucoma and avoid possible vision impairment.

Ocular Hypertension Epidemiology Perspective

The ocular hypertension epidemiology division offers information on the patient pool from history to the present as well as the projected trend for each of the 8 major markets. Expert Market Research provides both current and predicted trends for the ocular hypertension epidemiology scenario by examining a wide range of studies. Additionally, the report covers the diagnosed patient pool for Ocular Hypertension and their trends. The ocular hypertension detailed epidemiology segmentation is broken down into specific categories, such as the total diagnosed cases across different age groups and patient pools.

  • Studies show ocular hypertension rises with age, reaching 1.7–2.7% for those between the ages of 40 and 49, 2.7–4.6% for those between the ages of 50 and 59, and 4.1–7 .5% for those over 80.
  • As per the Indian Journal of Ophthalmology, a study conducted for ocular hypertension revealed that the male-female ratio was around 45 :65 having the visible complications of the disease.
  • As of 2022, around 3 million Americans had glaucoma , with over 120,000 cases of legal blindness linked to ocular hypertension. This indicates that ocular hypertension significantly increases the risk of developing glaucoma if left untreated.
  • In India, as per the Vellore Eye Study (VES), the prevalence of ocular hypertension was 3.0%, whereas according to the Andhra Pradesh Eye Disease Study (APEDS), this percentage was 0 .32%.
  • Ocular hypertension, which is more likely to develop as people age, is more common in older adults than in those under 40. Ocular hypertension is thought to affect 4 % to 10% of Americans over 40. One or both eyes may be affected by the condition.

Ocular Hypertension Number Of Cases By Country

Read more about this report - Request a Free Sample

Country-wise Ocular Hypertension Epidemiology Segment

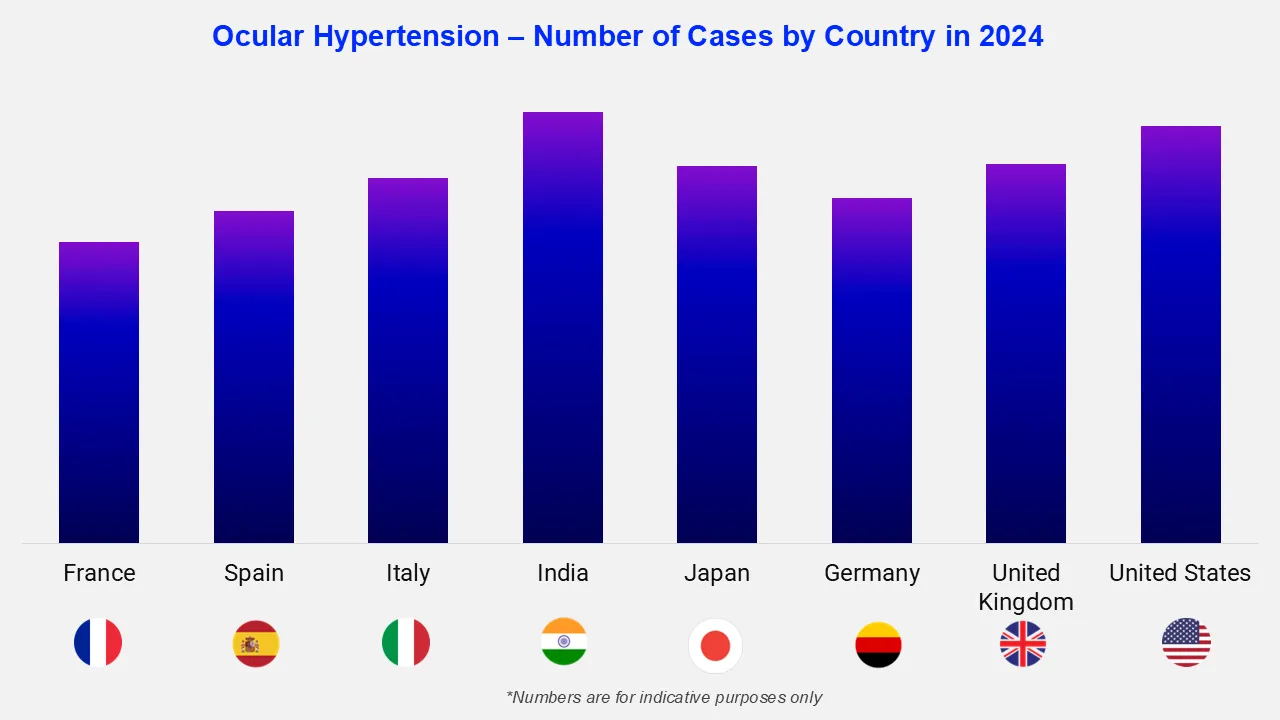
The ocular hypertension epidemiology data and findings for the United States, Germany, Spain, Italy, France, the United Kingdom, Japan, and India are also provided in the epidemiology section.

The epidemiology of ocular hypertension varies significantly between countries due to differences in factors such as elevated serum cholesterol, arterial hypertension, and diabetes mellitus. The prevalence of ocular hypertension in Chinese adults aged 40 and older is approximately 3.6 %. Additionally, disparities in screening practices, diagnostic criteria, and access to ophthalmologic care contribute to variation in reported prevalence across regions.

Ocular Hypertension: Treatment Overview

Ocular hypertension treatment involves lowering intraocular pressure (IOP). Prescription eye drops that improve the drainage of aqueous humor or reduce its production are usually used. Ocular hypertension therapeutics such as prostaglandin analogs (latanoprost and bimatoprost) are commonly used for their effectiveness in increasing aqueous humor outflow with once-daily dosing. To enhance fluid outflow, laser therapy such as selective laser trabeculoplasty may be employed in specific circumstances.

For improved pressure control, surgical techniques such as drainage implants or trabeculectomy are taken into consideration if required. To track IOP levels and avoid optic nerve damage, routine eye exams are essential. Combination eye drops, such as Combigan and Cosopt, offer the convenience of multiple mechanisms in a single bottle.

Key Questions Answered

  • What are the key findings of ocular hypertension epidemiology in the 8 major markets?
  • What will be the total number of patients with ocular hypertension across the 8 major markets during the forecast period?
  • What was the country-wise ocular hypertension epidemiology scenario in the 8 major markets in the historical period?
  • Which country will have the highest number of ocular hypertension cases during the forecast period of 2026-2035?
  • Which key factors would influence the shift in the patient population of ocular hypertension during the forecast period of 2026-2035?
  • What are the currently available treatments in the global ocular hypertension market?
  • What are the disease risks, signs, symptoms, and unmet needs of ocular hypertension?

Scope of the Ocular Hypertension Epidemiology Report

  • The ocular hypertension epidemiology forecast covers a detailed analysis of signs and symptoms, causes, risk factors, pathophysiology, diagnosis, treatment options, and classification/types of Ocular Hypertension based on several factors.
  • The Ocular Hypertension Epidemiology Forecast Report covers data for the eight major markets (the US, France, Germany, Italy, Spain, the UK, Japan, and India).
  • The ocular hypertension report helps to identify the patient population, and the unmet needs are highlighted along with an assessment of the disease's risk and burden.

Related Reports

Global Ocular Implants Market

Global Dry Eye Syndrome Market

*While we strive to always give you current and accurate information, the numbers depicted on the website are indicative and may differ from the actual numbers in the main report. At Expert Market Research, we aim to bring you the latest insights and trends in the market. Using our analyses and forecasts, stakeholders can understand the market dynamics, navigate challenges, and capitalize on opportunities to make data-driven strategic decisions.*

Looking for specific insights?

Get in touch with us for a customized solution tailored to your unique requirements and save upto 35%!

Report Summary

Explore our key highlights of the report and gain a concise overview of key findings, trends, and actionable insights that will empower your strategic decisions.

Key Highlights of the Report

Please note that the figures mentioned in the description serve as estimates and may vary from the actual figures presented in the final report.

Report Features

Details

Base Year

2025

Historical Period

2019-2025

Forecast Period

2026-2035

Geographies Covered

  • United States
  • Germany
  • Italy
  • France
  • Spain
  • United Kingdom
  • Japan
  • India

Datasheet

10 % Off

USD

1,999

1,799

Single User License

10 % Off

USD

2,999

2,699

Five User License

15 % Off

USD

4,399

3,739

Corporate License

15 % Off

USD

5,799

4,929

Datasheet

One User

USD 1,999

USD 1,799

tax inclusive*

  • Selected Segments
  • Printing Restrictions
  • Excel Spreadsheet Delivered via Email
  • Full Report
  • Periodic Updates
  • Post Sales Analysts Support
  • Unlimited Prints

Single User License

One User

USD 2,999

USD 2,699

tax inclusive*

  • All Segments
  • Printing Restrictions
  • PDF Delivered via Email
  • Custom Report Layout
  • Post Sales Analysts Support
  • Periodic Updates
  • Unlimited Prints

Five User License

Five User

USD 4,399

USD 3,739

tax inclusive*

  • All Segments
  • Five Prints Available
  • PDF Delivered via Email
  • Limited Free Customization
  • Post Sales Analyst Support
  • Custom Report Layout
  • Periodic Updates
  • Unlimited Prints

Corporate License

Unlimited Users

USD 5,799

USD 4,929

tax inclusive*

  • All Segments
  • Unlimited Prints Available
  • PDF & Excel Delivery via Email
  • Limited Free Customization
  • Post Sales Analysts Support
  • Discount On Next Update
  • Custom Report Layout

*Please note that the prices mentioned below are starting prices for each bundle type. Kindly contact our team for further details.*

Bundle Type

Flash Bundle

20% OFF Number of Reports: 3

Small Business Bundle

25% OFF Number of Reports: 5

Growth Bundle

30% OFF Number of Reports: 8

Enterprise Bundle

35% OFF Number of Reports: 10
Overview
  • Life Time Access
  • Analyst Support Related to Report
  • PDF Version of the Report
  • Complimentary Excel Data Set
  • Free Analyst Hours
  • Complimentary Free 1 Month Subscription to Trade Data Base
  • Complimentary One Month Subscription to Price Database (Chemicals only)
  • Complimentary PPT Version of the Report
  • Complimentary License Upgrade
  • Complimentary Power BI Dashboards
  • Life Time Access
  • Analyst Support Related to Report
  • PDF Version of the Report
  • Complimentary Excel Data Set
  • Free Analyst Hours - 50 Hours
  • Complimentary Free 1 Month Subscription to Trade Data Base
  • Complimentary One Month Subscription to Price Database (Chemicals only)
  • Complimentary PPT Version of the Report
  • Complimentary License Upgrade
  • Complimentary Power BI Dashboards
  • Life Time Access
  • Analyst Support Related to Report
  • PDF Version of the Report
  • Complimentary Excel Data Set
  • Free Analyst Hours - 80 Hours
  • Complimentary Free 1 Month Subscription to Trade Data Base
  • Complimentary One Month Subscription to Price Database (Chemicals only)
  • Complimentary PPT Version of the Report
  • Complimentary License Upgrade
  • Complimentary Power BI Dashboards
  • Life Time Access
  • Analyst Support Related to Report
  • PDF Version of the Report
  • Complimentary Excel Data Set
  • Free Analyst Hours - 100 Hours
  • Complimentary Free 1 Month Subscription to Trade Data Base
  • Complimentary One Month Subscription to Price Database (Chemicals only)
  • Complimentary PPT Version of the Report
  • Complimentary License Upgrade
  • Complimentary Power BI Dashboards

*Please note that the prices mentioned below are starting prices for each bundle type. Kindly contact our team for further details.*

Flash Bundle

Number of Reports: 3

20%

tax inclusive*

  • 3 Reports Included
  • Life Time Acess
  • Analyst Support Related to Report
  • PDF Version of the Report
  • Free 1 Month Subscription to Trade Data Base
  • 1 Month Subscription to Price Database (Chemicals only)
  • Complimentary Excel Data Set
  • PPT Version of the Report
  • Power BI Dashboards
  • License Upgrade
  • Free Analyst Hours

Small Business Bundle

Number of Reports: 5

25%

tax inclusive*

  • 5 Reports Included
  • Life Time Acess
  • Analyst Support Related to Report
  • PDF Version of the Report
  • Complimentary Excel Data Set
  • Free Analyst Hours - 50 Hours
  • Free 1 Month Subscription to Trade Data Base
  • 1 Month Subscription to Price Database (Chemicals only)
  • Complimentary Excel Data Set
  • PPT Version of the Report
  • Power BI Dashboards
  • License Upgrade

Growth Bundle

Number of Reports: 8

30%

tax inclusive*

  • 8 Reports Included
  • Life Time Acess
  • Analyst Support Related to Report
  • PDF Version of the Report
  • Complimentary Excel Data Set
  • Free Analyst Hours - 50 Hours
  • Free 1 Month Subscription to Trade Data Base
  • 1 Month Subscription to Price Database (Chemicals only)
  • License Upgrade
  • Free Analyst Hours - 80 Hours
  • Power BI Dashboards

Enterprise Bundle

Number of Reports: 10

35%

tax inclusive*

  • 10 Reports Included
  • Life Time Acess
  • Analyst Support Related to Report
  • PDF Version of the Report
  • Complimentary Excel Data Set
  • Free Analyst Hours - 50 Hours
  • Free 1 Month Subscription to Trade Data Base
  • 1 Month Subscription to Price Database (Chemicals only)
  • License Upgrade
  • Power BI Dashboards
  • Free Analyst Hours - 100 Hours

How To Order

This is a collaborative report by Vishakha Agrawal reflecting perspectives and research-driven insights from Expert Market Research.

Our step-by-step guide will help you select, purchase, and access your reports swiftly, ensuring you get the information that drives your decisions, right when you need it.

License Type

Select License Type

Choose the right license for your needs and access rights.

shopping cart

Click on ‘Buy Now’

Add the report to your cart with one click and proceed to register.

Select Mode of Payment

Choose a payment option for a secure checkout. You will be redirected accordingly.

Strategic Solutions for Informed Decision-Making

Connect For More Information

Our expert team of analysts will offer full support and resolve any queries regarding the report, before and after the purchase.

Our expert team of analysts will offer full support and resolve any queries regarding the report, before and after the purchase.

We employ meticulous research methods, blending advanced analytics and expert insights to deliver accurate, actionable industry intelligence, staying ahead of competitors.

Our skilled analysts offer unparalleled competitive advantage with detailed insights on current and emerging markets, ensuring your strategic edge.

We offer an in-depth yet simplified presentation of industry insights and analysis to meet your specific requirements effectively.

We’re here to help answer any questions about our products and services.

Contact us