Explore Our Diverse Range Of Offerings
From detailed reports to experts services offered in 15+ Industry Domains
Report
Press Release
Blogs
Industry Statistics
Add 2 More Reports For 20% off

Non-Radiographic Axial Spondyloarthritis (nr-AxSpA) Epidemiology Forecast

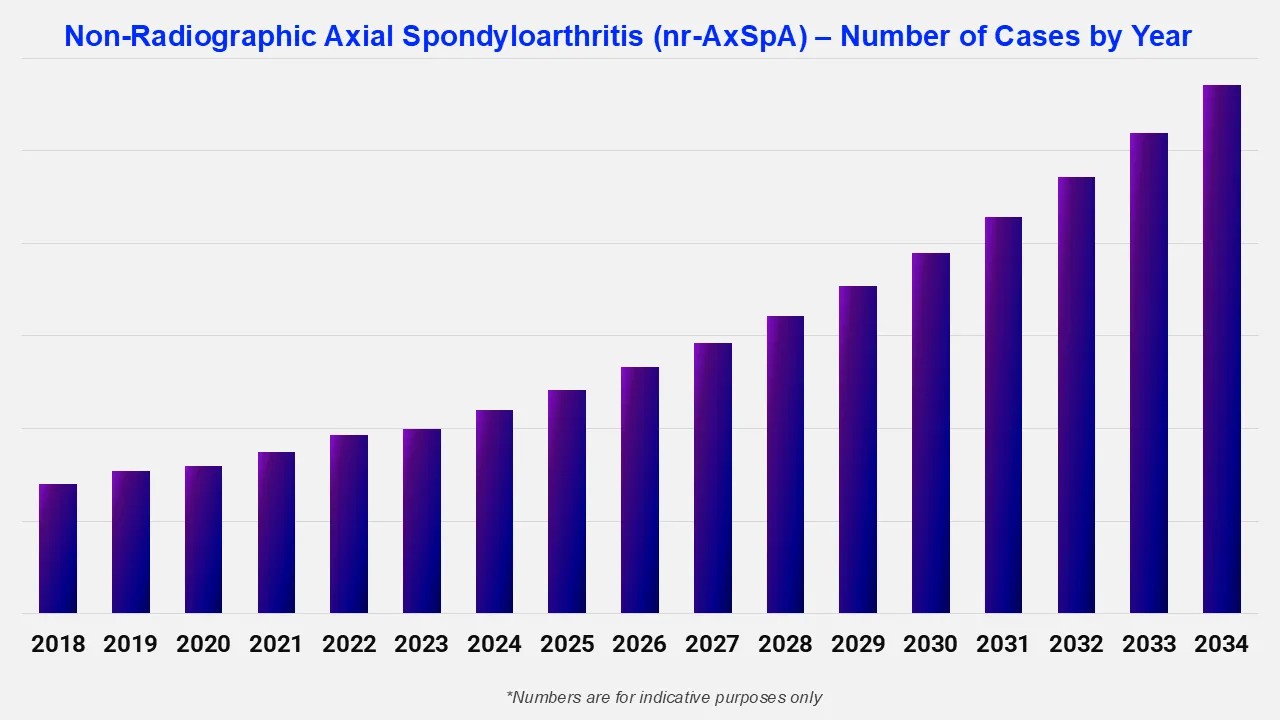
The non-radiographic axial spondyloarthritis (nr-AxSpA) epidemiology forecast suggests that non-radiographic axial spondyloarthritis (nr-AxSpA) and other related conditions typically start in young individuals, especially in people under the age of 45. Approximately 3.2 million Americans are affected by non-radiographic axial spondyloarthritis, according to the Spondylitis Association of America. Additionally, the male-to-female ratio of nr-AxSpA is estimated to be nearly 1:1.

2025

Base Year

2019-2025

Historical Period

2026-2035

Forecast Period

Non Radiographic Axial Spondyloarthritis Nr Axspa Number Of Cases By Year

Read more about this report - Request a Free Sample

Non-Radiographic Axial Spondyloarthritis (nr-AxSpA) Epidemiology Forecast Report Coverage

Expert Market Research's “Non-Radiographic Axial Spondyloarthritis (nr-AxSpA) Epidemiology Forecast Report 2026-2035” offers comprehensive information on the prevalence and demographics of non-radiographic axial spondyloarthritis (nr-AxSpA). It projects the future incidence and prevalence rates of non-radiographic axial spondyloarthritis (nr-AxSpA) cases across various populations. The study covers age and type as major determinants of the non-radiographic axial spondyloarthritis (nr-AxSpA) population. The report highlights patterns in the prevalence of non-radiographic axial spondyloarthritis (nr-AxSpA) over time and projects future trends based on multiple variables.

The report provides a comprehensive overview of the disease, as well as historical and projected data on non-radiographic axial spondyloarthritis (nr-AxSpA) epidemiology in the 8 major markets.

Regions Covered

  • The United States
  • Germany
  • France
  • Italy
  • Spain
  • The United Kingdom
  • Japan
  • India

Non-Radiographic Axial Spondyloarthritis (nr-AxSpA) Understanding: Disease Overview

Non-radiographic axial spondyloarthritis (nr-AxSpA) is a type of inflammatory arthritis that affects the spine and sacroiliac joints (the areas where the spine meets the pelvis). Unlike ankylosing spondylitis, non-radiographic axial spondyloarthritis (nr-AxSpA) doesn’t show any obvious damage to the bones on X-rays. This makes it challenging to diagnose the condition in the early stages.

Common symptoms include chronic lower back pain, especially in the morning or after sitting for long periods, and stiffness in the spine. For the diagnosis of non-radiographic axial spondyloarthritis (nr-AxSpA), a combination of clinical evaluation, MRI scans, and blood tests is performed to check for signs of inflammation or the genetic marker HLA-B27, which is found in many nr-AxSpA patients.

Non-Radiographic Axial Spondyloarthritis (nr-AxSpA) Epidemiology Perspective

The non-radiographic axial spondyloarthritis (nr-AxSpA) epidemiology division offers information on the patient pool from history to the present as well as the projected trend for each of the 8 major markets. Expert Market Research provides both current and predicted trends for non-radiographic axial spondyloarthritis (nr-AxSpA) epidemiology scenario by examining a wide range of studies. Additionally, the report covers the diagnosed patient pool for the disease and their trends. The non-radiographic axial spondyloarthritis (nr-AxSpA) detailed epidemiology segmentation is broken down into specific categories, such as the total diagnosed cases across different age groups and patient pools.

  • According to a 2018 review published in the Expert Review of Clinical Immunology, the lifetime risk of progression from non-radiographic axial spondyloarthritis (nr-AxSpA) to ankylosing spondylitis (AS) is estimated to be 50%.
  • Various studies suggest that around 5% to 10% of non-radiographic axial spondyloarthritis (nr-AxSpA) patients experience structural changes in the sacroiliac joints, which are indicative of ankylosing spondylitis (AS), within 2 years.
  • The male-to-female ratio in non-radiographic axial spondyloarthritis (nr-AxSpA) is nearly equal, with recent studies indicating that women may have a slightly higher likelihood of developing the condition. Additionally, demographic analyses suggest that around 55%-60% of individuals diagnosed with nr-axSpA are women.
  • The Spondylitis Association of America reports that non-radiographic axial spondyloarthritis (nr-AxSpA) often starts in young individuals, particularly those below the age of 45. It is also observed to occur early in life (in juveniles).

Non Radiographic Axial Spondyloarthritis Nr Axspa Number Of Cases By Country

Read more about this report - Request a Free Sample

Country-wise Non-Radiographic Axial Spondyloarthritis (nr-AxSpA) Epidemiology Segment

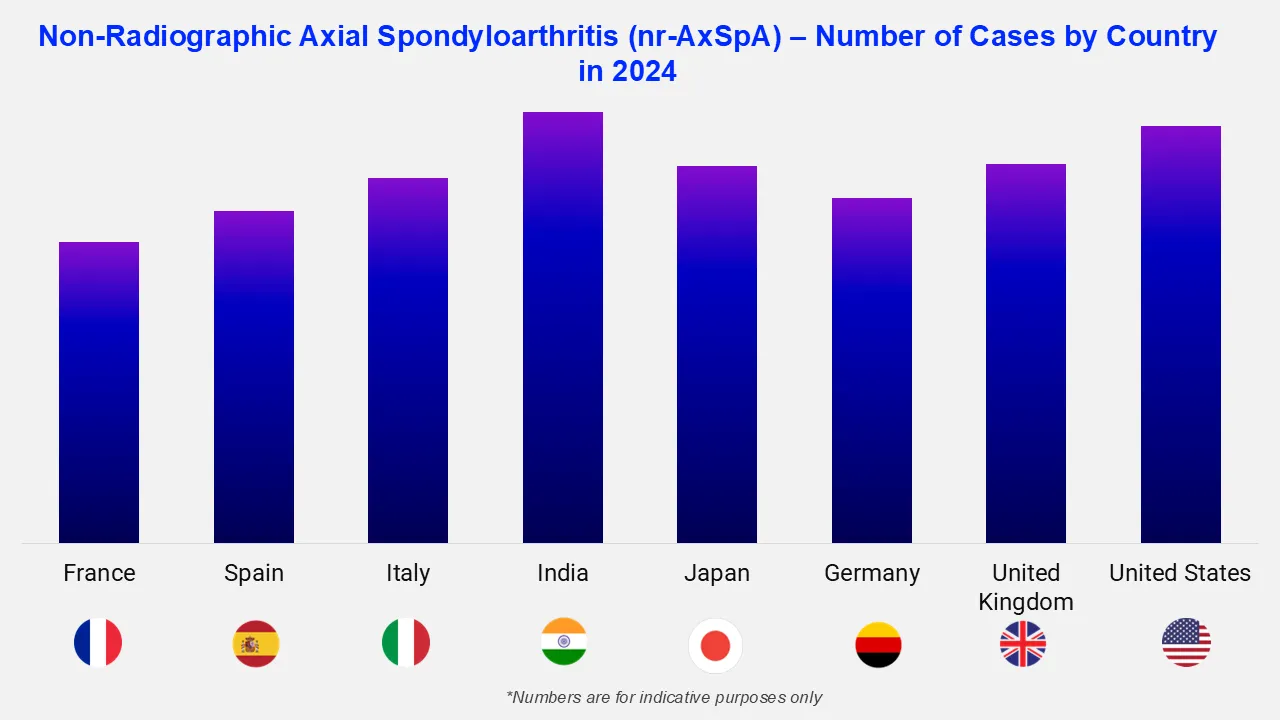
The non-radiographic axial spondyloarthritis (nr-AxSpA) epidemiology data and findings for the United States, Germany, Spain, Italy, France, the United Kingdom, Japan, and India are also provided in the epidemiology section.

The epidemiology of non-radiographic axial spondyloarthritis (nr-AxSpA) varies significantly between countries due to differences in factors such as genetic predisposition (such as the presence of the HLA-B27 gene), ethnic backgrounds, diet, infection rates, lifestyle patterns, healthcare access, the level of awareness about nr-AxSpA, and diagnostic practices, among others. According to the Spondylitis Association of America, about 3.2 million people in the United States are affected by non-radiographic axial spondyloarthritis.

Non-Radiographic Axial Spondyloarthritis (nr-AxSpA): Treatment Overview

The first line of treatment for non-radiographic axial spondyloarthritis (nr-AxSpA) typically involves NSAIDs (nonsteroidal anti-inflammatory drugs) to address pain and inflammation. Corticosteroids are prescribed to reduce swelling in cases where NSAIDs don’t work, while disease-modifying antirheumatic drugs (DMARDs) are recommended for more severe cases.

Biologic treatments such as TNF inhibitors or IL-17 inhibitors are also effective non-radiographic axial spondyloarthritis (nr-AxSpA) therapeutics. These are injections or infusions that target specific parts of the immune system that cause inflammation. Additionally, stretching and strengthening exercises can help manage stiffness and improve movement in the spine and other joints.

Key Questions Answered

  • What are the key findings of non-radiographic axial spondyloarthritis (nr-AxSpA) epidemiology in the 8 major markets?
  • What will be the total number of patients with non-radiographic axial spondyloarthritis (nr-AxSpA) across the 8 major markets during the forecast period?
  • What was the country-wise non-radiographic axial spondyloarthritis (nr-AxSpA) epidemiology scenario in the 8 major markets in the historical period?
  • Which country will have the highest number of non-radiographic axial spondyloarthritis (nr-AxSpA) patients during the forecast period of 2026-2035?
  • Which key factors would influence the shift in the patient population of non-radiographic axial spondyloarthritis (nr-AxSpA) during the forecast period of 2026-2035?
  • What are the currently available treatments in the non-radiographic axial spondyloarthritis (nr-AxSpA) market?
  • What are the disease risks, signs, symptoms, and unmet needs of non-radiographic axial spondyloarthritis (nr-AxSpA)?

Scope of the Non-Radiographic Axial Spondyloarthritis (nr-AxSpA) Epidemiology Report

  • The report covers a detailed analysis of signs and symptoms, causes, risk factors, pathophysiology, diagnosis, treatment options, and classification/types of non-radiographic axial spondyloarthritis (nr-AxSpA) based on several factors.
  • The Non-Radiographic Axial Spondyloarthritis (nr-AxSpA) Epidemiology Forecast Report covers data for the eight major markets (the US, France, Germany, Italy, Spain, the UK, Japan, and India).
  • The non-radiographic axial spondyloarthritis (nr-AxSpA) report helps to identify the patient population, and the unmet needs are highlighted along with an assessment of the disease's risk and burden.

Related Reports

Global Ankylosing Spondylitis Treatment Market

Global Rheumatoid Arthritis Therapeutics Market

*While we strive to always give you current and accurate information, the numbers depicted on the website are indicative and may differ from the actual numbers in the main report. At Expert Market Research, we aim to bring you the latest insights and trends in the market. Using our analyses and forecasts, stakeholders can understand the market dynamics, navigate challenges, and capitalize on opportunities to make data-driven strategic decisions.*

Looking for specific insights?

Get in touch with us for a customized solution tailored to your unique requirements and save upto 35%!

Report Summary

Explore our key highlights of the report and gain a concise overview of key findings, trends, and actionable insights that will empower your strategic decisions.

Key Highlights of the Report

Please note that the figures mentioned in the description serve as estimates and may vary from the actual figures presented in the final report.

Report Features

Details

Base Year

2025

Historical Period

2019-2025

Forecast Period

2026-2035

Geographies Covered

  • United States
  • Germany
  • Italy
  • France
  • Spain
  • United Kingdom
  • Japan
  • India

Datasheet

10 % Off

USD

1,999

1,799

Single User License

10 % Off

USD

2,999

2,699

Five User License

15 % Off

USD

4,399

3,739

Corporate License

15 % Off

USD

5,799

4,929

Datasheet

One User

USD 1,999

USD 1,799

tax inclusive*

  • Selected Segments
  • Printing Restrictions
  • Excel Spreadsheet Delivered via Email
  • Full Report
  • Periodic Updates
  • Post Sales Analysts Support
  • Unlimited Prints

Single User License

One User

USD 2,999

USD 2,699

tax inclusive*

  • All Segments
  • Printing Restrictions
  • PDF Delivered via Email
  • Custom Report Layout
  • Post Sales Analysts Support
  • Periodic Updates
  • Unlimited Prints

Five User License

Five User

USD 4,399

USD 3,739

tax inclusive*

  • All Segments
  • Five Prints Available
  • PDF Delivered via Email
  • Limited Free Customization
  • Post Sales Analyst Support
  • Custom Report Layout
  • Periodic Updates
  • Unlimited Prints

Corporate License

Unlimited Users

USD 5,799

USD 4,929

tax inclusive*

  • All Segments
  • Unlimited Prints Available
  • PDF & Excel Delivery via Email
  • Limited Free Customization
  • Post Sales Analysts Support
  • Discount On Next Update
  • Custom Report Layout

*Please note that the prices mentioned below are starting prices for each bundle type. Kindly contact our team for further details.*

Bundle Type

Flash Bundle

20% OFF Number of Reports: 3

Small Business Bundle

25% OFF Number of Reports: 5

Growth Bundle

30% OFF Number of Reports: 8

Enterprise Bundle

35% OFF Number of Reports: 10
Overview
  • Life Time Access
  • Analyst Support Related to Report
  • PDF Version of the Report
  • Complimentary Excel Data Set
  • Free Analyst Hours
  • Complimentary Free 1 Month Subscription to Trade Data Base
  • Complimentary One Month Subscription to Price Database (Chemicals only)
  • Complimentary PPT Version of the Report
  • Complimentary License Upgrade
  • Complimentary Power BI Dashboards
  • Life Time Access
  • Analyst Support Related to Report
  • PDF Version of the Report
  • Complimentary Excel Data Set
  • Free Analyst Hours - 50 Hours
  • Complimentary Free 1 Month Subscription to Trade Data Base
  • Complimentary One Month Subscription to Price Database (Chemicals only)
  • Complimentary PPT Version of the Report
  • Complimentary License Upgrade
  • Complimentary Power BI Dashboards
  • Life Time Access
  • Analyst Support Related to Report
  • PDF Version of the Report
  • Complimentary Excel Data Set
  • Free Analyst Hours - 80 Hours
  • Complimentary Free 1 Month Subscription to Trade Data Base
  • Complimentary One Month Subscription to Price Database (Chemicals only)
  • Complimentary PPT Version of the Report
  • Complimentary License Upgrade
  • Complimentary Power BI Dashboards
  • Life Time Access
  • Analyst Support Related to Report
  • PDF Version of the Report
  • Complimentary Excel Data Set
  • Free Analyst Hours - 100 Hours
  • Complimentary Free 1 Month Subscription to Trade Data Base
  • Complimentary One Month Subscription to Price Database (Chemicals only)
  • Complimentary PPT Version of the Report
  • Complimentary License Upgrade
  • Complimentary Power BI Dashboards

*Please note that the prices mentioned below are starting prices for each bundle type. Kindly contact our team for further details.*

Flash Bundle

Number of Reports: 3

20%

tax inclusive*

  • 3 Reports Included
  • Life Time Acess
  • Analyst Support Related to Report
  • PDF Version of the Report
  • Free 1 Month Subscription to Trade Data Base
  • 1 Month Subscription to Price Database (Chemicals only)
  • Complimentary Excel Data Set
  • PPT Version of the Report
  • Power BI Dashboards
  • License Upgrade
  • Free Analyst Hours

Small Business Bundle

Number of Reports: 5

25%

tax inclusive*

  • 5 Reports Included
  • Life Time Acess
  • Analyst Support Related to Report
  • PDF Version of the Report
  • Complimentary Excel Data Set
  • Free Analyst Hours - 50 Hours
  • Free 1 Month Subscription to Trade Data Base
  • 1 Month Subscription to Price Database (Chemicals only)
  • Complimentary Excel Data Set
  • PPT Version of the Report
  • Power BI Dashboards
  • License Upgrade

Growth Bundle

Number of Reports: 8

30%

tax inclusive*

  • 8 Reports Included
  • Life Time Acess
  • Analyst Support Related to Report
  • PDF Version of the Report
  • Complimentary Excel Data Set
  • Free Analyst Hours - 50 Hours
  • Free 1 Month Subscription to Trade Data Base
  • 1 Month Subscription to Price Database (Chemicals only)
  • License Upgrade
  • Free Analyst Hours - 80 Hours
  • Power BI Dashboards

Enterprise Bundle

Number of Reports: 10

35%

tax inclusive*

  • 10 Reports Included
  • Life Time Acess
  • Analyst Support Related to Report
  • PDF Version of the Report
  • Complimentary Excel Data Set
  • Free Analyst Hours - 50 Hours
  • Free 1 Month Subscription to Trade Data Base
  • 1 Month Subscription to Price Database (Chemicals only)
  • License Upgrade
  • Power BI Dashboards
  • Free Analyst Hours - 100 Hours

How To Order

This is a collaborative report by Vishakha Agrawal reflecting perspectives and research-driven insights from Expert Market Research.

Our step-by-step guide will help you select, purchase, and access your reports swiftly, ensuring you get the information that drives your decisions, right when you need it.

License Type

Select License Type

Choose the right license for your needs and access rights.

shopping cart

Click on ‘Buy Now’

Add the report to your cart with one click and proceed to register.

Select Mode of Payment

Choose a payment option for a secure checkout. You will be redirected accordingly.

Strategic Solutions for Informed Decision-Making

Connect For More Information

Our expert team of analysts will offer full support and resolve any queries regarding the report, before and after the purchase.

Our expert team of analysts will offer full support and resolve any queries regarding the report, before and after the purchase.

We employ meticulous research methods, blending advanced analytics and expert insights to deliver accurate, actionable industry intelligence, staying ahead of competitors.

Our skilled analysts offer unparalleled competitive advantage with detailed insights on current and emerging markets, ensuring your strategic edge.

We offer an in-depth yet simplified presentation of industry insights and analysis to meet your specific requirements effectively.

We’re here to help answer any questions about our products and services.

Contact us